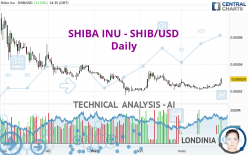
SHIBA INU - SHIB/USD - Daily - Technical analysis published on 03/28/2022 (GMT)
- 224
- 0
Click here for a new analysis!
- Timeframe : Daily
- - Analysis generated on
- Status : INVALID

Summary of the analysis
Additional analysis
Quotes
The SHIBA INU - SHIB/USD price is 0.000029 USD. The price registered an increase of +11.54% on the session and was between 0.000025 USD and 0.000030 USD. This implies that the price is at +16.00% from its lowest and at -3.33% from its highest.A study of price movements over other periods shows the following variations:
New HIGH record (1 month)
Type : Bullish
Timeframe : Weekly
The Central Volumes scanner detects abnormal volumes on the asset:
Abnormal volumes
Timeframe : 5 days
Abnormal volumes
Timeframe : 20 days
Abnormal volumes
Timeframe : 50 days
Technical
A technical analysis in Daily of this SHIBA INU - SHIB/USD chart shows a slightly bullish trend. 53.57% of the signals given by moving averages are bullish. This slightly bullish trend could be reinforced by the strong bullish signals given by short-term moving averages. An assessment of moving averages reveals several bullish signals that could impact this trend:
Bullish trend reversal : adaptative moving average 50
Type : Bullish
Timeframe : Daily
Bullish price crossover with Moving Average 100
Type : Bullish
Timeframe : Daily
Bullish price crossover with adaptative moving average 50
Type : Bullish
Timeframe : Daily
Bullish price crossover with adaptative moving average 100
Type : Bullish
Timeframe : Daily
In fact, 15 technical indicators on 18 studied are currently bullish. Caution: the Central Indicators scanner currently detects an excess:
CCI indicator is overbought : over 100
Type : Neutral
Timeframe : Daily
Williams %R indicator is overbought : over -20
Type : Neutral
Timeframe : Daily
Pivot points : price is over resistance 3
Type : Neutral
Timeframe : Daily
Pivot points : price is over resistance 3
Type : Neutral
Timeframe : Weekly
Ichimoku : price is over the cloud
Type : Bullish
Timeframe : Daily
SuperTrend indicator bullish reversal
Type : Bullish
Timeframe : Daily
MACD indicator is back over 0
Type : Bullish
Timeframe : Daily
Central Patterns, the scanner specializing in chart patterns, did not identify any signals.
The Central Candlesticks scanner, specialised in Japanese candlesticks, did not identify any signals.
| S2 | S1 | Price | R1 | R2 | R3 | |
|---|---|---|---|---|---|---|
| ProTrendLines | 0.000007 | 0.000021 | 0.000029 | 0.000031 | 0.000047 | 0.000065 |
| Change (%) | -75.86% | -27.59% | - | +6.90% | +62.07% | +124.14% |
| Change | -0.000022 | -0.000008 | - | +0.000002 | +0.000018 | +0.000036 |
| Level | Minor | Major | - | Intermediate | Minor | Minor |
To determine price objectives, it is also possible to use the pivot points. Here is the price position in relation to pivot points:
| Pivot points | S3 | S2 | S1 | PP | R1 | R2 | R3 |
|---|---|---|---|---|---|---|---|
| Standard | 0.000023 | 0.000023 | 0.000025 | 0.000025 | 0.000027 | 0.000027 | 0.000029 |
| Camarilla | 0.000026 | 0.000026 | 0.000026 | 0.000026 | 0.000026 | 0.000026 | 0.000027 |
| Woodie | 0.000023 | 0.000024 | 0.000025 | 0.000026 | 0.000027 | 0.000028 | 0.000029 |
| Fibonacci | 0.000023 | 0.000024 | 0.000025 | 0.000025 | 0.000026 | 0.000027 | 0.000027 |
| Pivot points | S3 | S2 | S1 | PP | R1 | R2 | R3 |
|---|---|---|---|---|---|---|---|
| Standard | 0.000019 | 0.000021 | 0.000022 | 0.000024 | 0.000025 | 0.000027 | 0.000028 |
| Camarilla | 0.000023 | 0.000024 | 0.000024 | 0.000024 | 0.000024 | 0.000025 | 0.000025 |
| Woodie | 0.000020 | 0.000021 | 0.000023 | 0.000024 | 0.000026 | 0.000027 | 0.000029 |
| Fibonacci | 0.000021 | 0.000022 | 0.000023 | 0.000024 | 0.000025 | 0.000026 | 0.000027 |
| Pivot points | S3 | S2 | S1 | PP | R1 | R2 | R3 |
|---|---|---|---|---|---|---|---|
| Standard | 0.000006 | 0.000013 | 0.000020 | 0.000027 | 0.000034 | 0.000041 | 0.000048 |
| Camarilla | 0.000022 | 0.000023 | 0.000025 | 0.000026 | 0.000027 | 0.000029 | 0.000030 |
| Woodie | 0.000005 | 0.000013 | 0.000019 | 0.000027 | 0.000033 | 0.000041 | 0.000047 |
| Fibonacci | 0.000013 | 0.000019 | 0.000022 | 0.000027 | 0.000033 | 0.000036 | 0.000041 |
Numerical data
The following are the details of the technical indicators and moving averages that were collected to generate this technical analysis:
| RSI (14): | 65.84 | |
| MACD (12,26,9): | 0.0000 | |
| Directional Movement: | 17.293108 | |
| AROON (14): | 100.000000 | |
| DEMA (21): | 0.000024 | |
| Parabolic SAR (0,02-0,02-0,2): | 0.000021 | |
| Elder Ray (13): | 0.000003 | |
| Super Trend (3,10): | 0.000022 | |
| Zig ZAG (10): | 0.000028 | |
| VORTEX (21): | 1.1000 | |
| Stochastique (14,3,5): | 91.67 | |
| TEMA (21): | 0.000025 | |
| Williams %R (14): | 0.00 | |
| Chande Momentum Oscillator (20): | 0.000006 | |
| Repulse (5,40,3): | 21.3091 | |
| ROCnROLL: | 1 | |
| TRIX (15,9): | -0.1996 | |
| Courbe Coppock: | 24.94 |
| MA7: | 0.000025 | |
| MA20: | 0.000023 | |
| MA50: | 0.000026 | |
| MA100: | 0.000027 | |
| MAexp7: | 0.000026 | |
| MAexp20: | 0.000024 | |
| MAexp50: | 0.000025 | |
| MAexp100: | 0.000026 | |
| Price / MA7: | +16.00% | |
| Price / MA20: | +26.09% | |
| Price / MA50: | +11.54% | |
| Price / MA100: | +7.41% | |
| Price / MAexp7: | +11.54% | |
| Price / MAexp20: | +20.83% | |
| Price / MAexp50: | +16.00% | |
| Price / MAexp100: | +11.54% |
About author

Online


Add a comment
Comments
0 comments on the analysis SHIBA INU - SHIB/USD - Daily