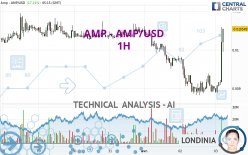
AMP - AMP/USD - 1H - Technical analysis published on 04/03/2024 (GMT)
- 126
- 0
Click here for a new analysis!
- Timeframe : 1H
- - Analysis generated on
- Status : INVALID

Summary of the analysis

Additional analysis
Quotes
The AMP - AMP/USD rating is 0.010549 USD. On the day, this instrument gained +17.21% with the lowest point at 0.008880 USD and the highest point at 0.010599 USD. The deviation from the price is +18.80% for the low point and -0.47% for the high point.A study of price movements over other periods shows the following variations:
Abnormal volumes
Timeframe : 20 days
Abnormal volumes
Timeframe : 50 days
Technical
Technical analysis of AMP - AMP/USD in 1H shows an overall slightly bullish trend. Only 53.57% of the signals given by moving averages are bullish. This slightly bullish trend is reinforced by the strong signals currently being given by short-term moving averages. The Central Indicators scanner detects bullish signals on moving averages that could impact this trend:
Bullish trend reversal : Moving Average 20
Type : Bullish
Timeframe : 1 hour
Bullish trend reversal : adaptative moving average 50
Type : Bullish
Timeframe : 1 hour
Bullish trend reversal : adaptative moving average 100
Type : Bullish
Timeframe : 1 hour
In fact, according to the parameters integrated into the Central Analyzer system, 17 technical indicators out of 18 analysed are currently bullish. Caution: the Central Indicators scanner currently detects an excess:
RSI indicator is overbought : over 70
Type : Neutral
Timeframe : 1 hour
CCI indicator is overbought : over 100
Type : Neutral
Timeframe : 1 hour
Previous candle closed over Bollinger bands
Type : Neutral
Timeframe : 1 hour
Williams %R indicator is overbought : over -20
Type : Neutral
Timeframe : 1 hour
Pivot points : price is over resistance 1
Type : Neutral
Timeframe : 1 hour
MACD indicator is back over 0
Type : Bullish
Timeframe : 1 hour
No signals are given by Central Patterns, a market scanner specialised in chart patterns, resistances and supports.
The presence of a bullish Japanese candlestick pattern detected by Central Candlesticks that could cause a very short term rebound was also detected:
Long white line
Type : Bullish
Timeframe : 1 hour
| S3 | S2 | S1 | Price | R1 | R2 | R3 | |
|---|---|---|---|---|---|---|---|
| ProTrendLines | 0.008821 | 0.009379 | 0.010180 | 0.010549 | 0.010560 | 0.011077 | 0.012920 |
| Change (%) | -16.38% | -11.09% | -3.50% | - | +0.10% | +5.01% | +22.48% |
| Change | -0.001728 | -0.001170 | -0.000369 | - | +0.000011 | +0.000528 | +0.002371 |
| Level | Intermediate | Minor | Intermediate | - | Major | Intermediate | Intermediate |
Attention could also be paid to pivot points to set price objectives:
| Pivot points | S3 | S2 | S1 | PP | R1 | R2 | R3 |
|---|---|---|---|---|---|---|---|
| Standard | 0.007608 | 0.008215 | 0.008607 | 0.009214 | 0.009606 | 0.010213 | 0.010605 |
| Camarilla | 0.008725 | 0.008817 | 0.008908 | 0.009000 | 0.009092 | 0.009183 | 0.009275 |
| Woodie | 0.007502 | 0.008161 | 0.008501 | 0.009160 | 0.009500 | 0.010159 | 0.010499 |
| Fibonacci | 0.008215 | 0.008596 | 0.008832 | 0.009214 | 0.009595 | 0.009831 | 0.010213 |
| Pivot points | S3 | S2 | S1 | PP | R1 | R2 | R3 |
|---|---|---|---|---|---|---|---|
| Standard | 0.007997 | 0.009049 | 0.009704 | 0.010756 | 0.011411 | 0.012463 | 0.013118 |
| Camarilla | 0.009891 | 0.010047 | 0.010204 | 0.010360 | 0.010517 | 0.010673 | 0.010829 |
| Woodie | 0.007800 | 0.008950 | 0.009507 | 0.010657 | 0.011214 | 0.012364 | 0.012921 |
| Fibonacci | 0.009049 | 0.009701 | 0.010104 | 0.010756 | 0.011408 | 0.011811 | 0.012463 |
| Pivot points | S3 | S2 | S1 | PP | R1 | R2 | R3 |
|---|---|---|---|---|---|---|---|
| Standard | -0.007993 | -0.001777 | 0.004372 | 0.010588 | 0.016737 | 0.022953 | 0.029102 |
| Camarilla | 0.007120 | 0.008253 | 0.009387 | 0.010520 | 0.011654 | 0.012787 | 0.013920 |
| Woodie | -0.008028 | -0.001794 | 0.004338 | 0.010571 | 0.016703 | 0.022936 | 0.029068 |
| Fibonacci | -0.001777 | 0.002947 | 0.005865 | 0.010588 | 0.015312 | 0.018230 | 0.022953 |
Numerical data
The following are the details of the technical indicators and moving averages that were collected to generate this technical analysis:
| RSI (14): | 68.35 | |
| MACD (12,26,9): | 0.0001 | |
| Directional Movement: | 36.509430 | |
| AROON (14): | 85.714286 | |
| DEMA (21): | 0.009296 | |
| Parabolic SAR (0,02-0,02-0,2): | 0.008914 | |
| Elder Ray (13): | 0.000737 | |
| Super Trend (3,10): | 0.009307 | |
| Zig ZAG (10): | 0.010220 | |
| VORTEX (21): | 1.2259 | |
| Stochastique (14,3,5): | 71.22 | |
| TEMA (21): | 0.009542 | |
| Williams %R (14): | -37.54 | |
| Chande Momentum Oscillator (20): | 0.001010 | |
| Repulse (5,40,3): | 9.6968 | |
| ROCnROLL: | 1 | |
| TRIX (15,9): | -0.1555 | |
| Courbe Coppock: | 9.84 |
| MA7: | 0.010121 | |
| MA20: | 0.010524 | |
| MA50: | 0.007528 | |
| MA100: | 0.005532 | |
| MAexp7: | 0.009578 | |
| MAexp20: | 0.009323 | |
| MAexp50: | 0.009496 | |
| MAexp100: | 0.009793 | |
| Price / MA7: | +4.23% | |
| Price / MA20: | +0.24% | |
| Price / MA50: | +40.13% | |
| Price / MA100: | +90.69% | |
| Price / MAexp7: | +10.14% | |
| Price / MAexp20: | +13.15% | |
| Price / MAexp50: | +11.09% | |
| Price / MAexp100: | +7.72% |
About author
Online


Add a comment
Comments
0 comments on the analysis AMP - AMP/USD - 1H