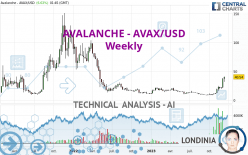
AVALANCHE - AVAX/USD - Weekly - Technical analysis published on 12/12/2023 (GMT)
- 117
- 0
Click here for a new analysis!
- Timeframe : Weekly
- - Analysis generated on
- Status : TARGET REACHED

Summary of the analysis

Additional analysis
Quotes
The AVALANCHE - AVAX/USD price is 40.54 USD. The price is up +65.13% over 5 days and has been traded over the last 5 days between 25.76 USD and 40.81 USD. This implies that the 5 day price is +57.38% from its lowest point and -0.66% from its highest point.So that you have an overall view of the price change, here is a table showing the variations over several periods:
Near a new HIGH record (1 year)
Type : Bullish
Timeframe : Weekly
New HIGH record (1 month)
Type : Bullish
Timeframe : Weekly
The Central Volumes scanner notes the presence of abnormal volumes:
Abnormal volumes
Timeframe : 5 days
Abnormal volumes
Timeframe : 20 days
Abnormal volumes
Timeframe : 50 days
Technical
Technical analysis of this Weekly chart of AVALANCHE - AVAX/USD indicates that the overall trend is bullish. The signals returned by the moving averages are 64.29% bullish. This bullish trend is reinforced by the strong signals currently being given by short-term moving averages. The Central Indicators market scanner is currently detecting a bullish signal that could impact this trend:
Moving Average bullish crossovers : AMA20 & AMA50
Type : Bullish
Timeframe : Weekly
In fact, according to the parameters integrated into the Central Analyzer system, 17 technical indicators out of 18 analysed are currently bullish. Caution: the Central Indicators scanner currently detects an excess:
RSI indicator is overbought : over 80
Type : Neutral
Timeframe : Weekly
CCI indicator is overbought : over 100
Type : Neutral
Timeframe : Weekly
Previous candle closed over Bollinger bands
Type : Neutral
Timeframe : Weekly
Williams %R indicator is overbought : over -20
Type : Neutral
Timeframe : Weekly
Pivot points : price is over resistance 1
Type : Neutral
Timeframe : Weekly
The Central Patterns scanner, which studies chart patterns, resistances and supports, has identified this signal:
Near horizontal resistance
Type : Bearish
Timeframe : Weekly
Central Candlesticks, the scanner specialised in Japanese candlesticks, detects a bullish signal that could support the hypothesis of a small rebound in the very short term:
Long white line
Type : Bullish
Timeframe : Weekly
| S3 | S2 | S1 | Price | R1 | R2 | R3 | |
|---|---|---|---|---|---|---|---|
| ProTrendLines | 9.73 | 20.94 | 39.13 | 40.54 | 59.79 | 98.08 | 135.29 |
| Change (%) | -76.00% | -48.35% | -3.48% | - | +47.48% | +141.93% | +233.72% |
| Change | -30.81 | -19.60 | -1.41 | - | +19.25 | +57.54 | +94.75 |
| Level | Major | Intermediate | Intermediate | - | Minor | Minor | Major |
Pivot points can also be used to set your price objectives. Here is the price situation in relation to pivot points:
| Pivot points | S3 | S2 | S1 | PP | R1 | R2 | R3 |
|---|---|---|---|---|---|---|---|
| Standard | 25.95 | 28.91 | 33.46 | 36.42 | 40.97 | 43.93 | 48.48 |
| Camarilla | 35.96 | 36.64 | 37.33 | 38.02 | 38.71 | 39.40 | 40.09 |
| Woodie | 26.76 | 29.31 | 34.27 | 36.82 | 41.78 | 44.33 | 49.29 |
| Fibonacci | 28.91 | 31.78 | 33.55 | 36.42 | 39.29 | 41.06 | 43.93 |
| Pivot points | S3 | S2 | S1 | PP | R1 | R2 | R3 |
|---|---|---|---|---|---|---|---|
| Standard | 10.09 | 15.41 | 23.64 | 28.96 | 37.19 | 42.51 | 50.74 |
| Camarilla | 28.13 | 29.38 | 30.62 | 31.86 | 33.10 | 34.34 | 35.59 |
| Woodie | 11.54 | 16.14 | 25.09 | 29.69 | 38.64 | 43.24 | 52.19 |
| Fibonacci | 15.41 | 20.59 | 23.79 | 28.96 | 34.14 | 37.34 | 42.51 |
| Pivot points | S3 | S2 | S1 | PP | R1 | R2 | R3 |
|---|---|---|---|---|---|---|---|
| Standard | -0.56 | 5.16 | 13.27 | 18.99 | 27.10 | 32.82 | 40.93 |
| Camarilla | 17.58 | 18.85 | 20.11 | 21.38 | 22.65 | 23.92 | 25.18 |
| Woodie | 0.64 | 5.76 | 14.47 | 19.59 | 28.30 | 33.42 | 42.13 |
| Fibonacci | 5.16 | 10.44 | 13.71 | 18.99 | 24.27 | 27.54 | 32.82 |
Numerical data
The following are the details of the technical indicators and moving averages that were collected to generate this technical analysis:
| RSI (14): | 84.70 | |
| MACD (12,26,9): | 4.1700 | |
| Directional Movement: | 48.76 | |
| AROON (14): | 78.57 | |
| DEMA (21): | 22.66 | |
| Parabolic SAR (0,02-0,02-0,2): | 13.60 | |
| Elder Ray (13): | 14.97 | |
| Super Trend (3,10): | 22.38 | |
| Zig ZAG (10): | 40.58 | |
| VORTEX (21): | 1.2700 | |
| Stochastique (14,3,5): | 91.00 | |
| TEMA (21): | 27.69 | |
| Williams %R (14): | -0.59 | |
| Chande Momentum Oscillator (20): | 31.81 | |
| Repulse (5,40,3): | 70.1100 | |
| ROCnROLL: | 1 | |
| TRIX (15,9): | 1.0000 | |
| Courbe Coppock: | 294.20 |
| MA7: | 32.91 | |
| MA20: | 25.56 | |
| MA50: | 19.30 | |
| MA100: | 14.37 | |
| MAexp7: | 26.25 | |
| MAexp20: | 18.65 | |
| MAexp50: | 18.00 | |
| MAexp100: | 21.95 | |
| Price / MA7: | +23.18% | |
| Price / MA20: | +58.61% | |
| Price / MA50: | +110.05% | |
| Price / MA100: | +182.12% | |
| Price / MAexp7: | +54.44% | |
| Price / MAexp20: | +117.37% | |
| Price / MAexp50: | +125.22% | |
| Price / MAexp100: | +84.69% |
About author

Online


Add a comment
Comments
0 comments on the analysis AVALANCHE - AVAX/USD - Weekly