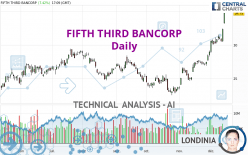
FIFTH THIRD BANCORP - Daily - Technical analysis published on 12/14/2023 (GMT)
- 122
- 0
Click here for a new analysis!
- Timeframe : Daily
- - Analysis generated on
- Status : LEVEL MAINTAINED

Summary of the analysis

Additional analysis
Quotes
The FIFTH THIRD BANCORP rating is 34.74 USD. The price has increased by +7.39% since the last closing and was between 33.19 USD and 34.75 USD. This implies that the price is at +4.67% from its lowest and at -0.03% from its highest.A bullish gap was detected at the opening by the Central Gaps scanner. There are a lot of buyers and they have the upper hand in the very short term.
Opening Gap UP
Type : Bullish
Timeframe : Openning
A study of price movements over other periods shows the following variations:
New HIGH record (1 month)
Type : Bullish
Timeframe : Weekly
Technical
Technical analysis of FIFTH THIRD BANCORP in Daily shows a strongly overall bullish trend. The signals given by the moving averages are 92.86% bullish. This strong bullish trend is confirmed by the strong signals currently being given by short-term moving averages. The Central Indicators market scanner is currently detecting a bullish signal that could impact this trend:
Moving Average bullish crossovers : MA50 & MA100
Type : Bullish
Timeframe : Daily
In fact, 16 technical indicators on 18 studied are currently positioned bullish. Caution: the Central Indicators scanner currently detects an excess:
RSI indicator is overbought : over 80
Type : Neutral
Timeframe : Daily
CCI indicator is overbought : over 100
Type : Neutral
Timeframe : Daily
Williams %R indicator is overbought : over -20
Type : Neutral
Timeframe : Daily
Pivot points : price is over resistance 2
Type : Neutral
Timeframe : Daily
Pivot points : price is over resistance 3
Type : Neutral
Timeframe : Weekly
An analysis of the price chart with the Central Patterns scanner (detector of chart patterns and resistances and supports) shows several results that can have an impact on the price change:
Near horizontal resistance
Type : Bearish
Timeframe : Daily
Resistance of channel is broken
Type : Bullish
Timeframe : Daily
For a small rebound in the very short term, the Central Candlesticks scanner currently notes the presence of this bullish pattern in Japanese candlesticks:
Upside gap
Type : Bullish
Timeframe : Daily
| S3 | S2 | S1 | Price | R1 | R2 | R3 | |
|---|---|---|---|---|---|---|---|
| ProTrendLines | 27.26 | 28.85 | 31.70 | 34.74 | 36.40 | 42.02 | 46.82 |
| Change (%) | -21.53% | -16.95% | -8.75% | - | +4.78% | +20.96% | +34.77% |
| Change | -7.48 | -5.89 | -3.04 | - | +1.66 | +7.28 | +12.08 |
| Level | Major | Major | Intermediate | - | Intermediate | Minor | Major |
Pivot points can also be used to set your price objectives. Here is the price situation in relation to pivot points:
| Pivot points | S3 | S2 | S1 | PP | R1 | R2 | R3 |
|---|---|---|---|---|---|---|---|
| Standard | 29.12 | 29.80 | 31.07 | 31.75 | 33.02 | 33.70 | 34.97 |
| Camarilla | 31.81 | 31.99 | 32.17 | 32.35 | 32.53 | 32.71 | 32.89 |
| Woodie | 29.43 | 29.95 | 31.38 | 31.90 | 33.33 | 33.85 | 35.28 |
| Fibonacci | 29.80 | 30.54 | 31.00 | 31.75 | 32.49 | 32.95 | 33.70 |
| Pivot points | S3 | S2 | S1 | PP | R1 | R2 | R3 |
|---|---|---|---|---|---|---|---|
| Standard | 28.84 | 29.42 | 30.34 | 30.92 | 31.84 | 32.42 | 33.34 |
| Camarilla | 30.84 | 30.98 | 31.11 | 31.25 | 31.39 | 31.53 | 31.66 |
| Woodie | 29.00 | 29.51 | 30.50 | 31.01 | 32.00 | 32.51 | 33.50 |
| Fibonacci | 29.42 | 30.00 | 30.35 | 30.92 | 31.50 | 31.85 | 32.42 |
| Pivot points | S3 | S2 | S1 | PP | R1 | R2 | R3 |
|---|---|---|---|---|---|---|---|
| Standard | 19.37 | 21.37 | 25.16 | 27.16 | 30.95 | 32.95 | 36.74 |
| Camarilla | 27.36 | 27.89 | 28.42 | 28.95 | 29.48 | 30.01 | 30.54 |
| Woodie | 20.27 | 21.82 | 26.06 | 27.61 | 31.85 | 33.40 | 37.64 |
| Fibonacci | 21.37 | 23.58 | 24.95 | 27.16 | 29.37 | 30.74 | 32.95 |
Numerical data
The following is the status of the technical indicators and moving averages at the time of publication of this technical analysis:
| RSI (14): | 81.60 | |
| MACD (12,26,9): | 1.7500 | |
| Directional Movement: | 48.27 | |
| AROON (14): | 85.71 | |
| DEMA (21): | 31.91 | |
| Parabolic SAR (0,02-0,02-0,2): | 30.47 | |
| Elder Ray (13): | 3.22 | |
| Super Trend (3,10): | 30.90 | |
| Zig ZAG (10): | 34.64 | |
| VORTEX (21): | 1.3400 | |
| Stochastique (14,3,5): | 92.21 | |
| TEMA (21): | 32.86 | |
| Williams %R (14): | -1.09 | |
| Chande Momentum Oscillator (20): | 7.19 | |
| Repulse (5,40,3): | 9.8700 | |
| ROCnROLL: | 1 | |
| TRIX (15,9): | 0.7700 | |
| Courbe Coppock: | 31.68 |
| MA7: | 31.54 | |
| MA20: | 29.41 | |
| MA50: | 26.54 | |
| MA100: | 26.42 | |
| MAexp7: | 31.85 | |
| MAexp20: | 29.77 | |
| MAexp50: | 27.74 | |
| MAexp100: | 27.01 | |
| Price / MA7: | +10.15% | |
| Price / MA20: | +18.12% | |
| Price / MA50: | +30.90% | |
| Price / MA100: | +31.49% | |
| Price / MAexp7: | +9.07% | |
| Price / MAexp20: | +16.69% | |
| Price / MAexp50: | +25.23% | |
| Price / MAexp100: | +28.62% |
News
The latest news and videos published on FIFTH THIRD BANCORP at the time of the analysis were as follows:
- SHAREHOLDER ALERT: Pomerantz Law Firm Investigates Claims On Behalf of Investors of Fifth Third Bancorp - FITB
- ROSEN, A LEADING LAW FIRM, Encourages Fifth Third Bancorp Investors to Inquire About Securities Class Action Investigation - FITB
- SHAREHOLDER ALERT: Pomerantz Law Firm Investigates Claims On Behalf of Investors of Fifth Third Bancorp - FITB
- SHAREHOLDER ALERT: Pomerantz Law Firm Investigates Claims On Behalf of Investors of Fifth Third Bancorp - FITB
- SHAREHOLDER ALERT: Pomerantz Law Firm Investigates Claims On Behalf of Investors of Fifth Third Bancorp - FITB
About author
Online


Add a comment
Comments
0 comments on the analysis FIFTH THIRD BANCORP - Daily