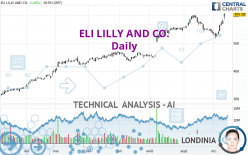
ELI LILLY AND CO. - Daily - Technical analysis published on 10/12/2023 (GMT)
- 131
- 0
Click here for a new analysis!
- Timeframe : Daily
- - Analysis generated on
- Status : INVALID

Summary of the analysis

Additional analysis
Quotes
ELI LILLY AND CO. rating 605.28 USD. The price has increased by +4.48% since the last closing with the lowest point at 585.01 USD and the highest point at 608.79 USD. The deviation from the price is +3.46% for the low point and -0.58% for the high point.The Central Gaps scanner detects the formation of a bullish gap marking the strong presence of buyers against sellers at the opening. This formed a quotation gap.
Opening Gap UP
Type : Bullish
Timeframe : Openning
So that you have an overall view of the price change, here is a table showing the variations over several periods:
New HIGH record (5 years)
Type : Bullish
Timeframe : Weekly
New HIGH record (1 year)
Type : Bullish
Timeframe : Weekly
New HIGH record (1st january)
Type : Bullish
Timeframe : Weekly
New HIGH record (1 month)
Type : Bullish
Timeframe : Weekly
Technical
Technical analysis of ELI LILLY AND CO. in Daily shows a strongly overall bullish trend. 92.86% of the signals given by moving averages are bullish. This strongly bullish trend is supported by the strong bullish signals given by short-term moving averages. The Central Indicators scanner detects a bullish signal on moving averages that could impact this trend:
Moving Average bullish crossovers : AMA50 & AMA100
Type : Bullish
Timeframe : Daily
The probability of a further increase is high given the direction of the technical indicators.
Caution: the Central Indicators scanner currently detects an excess:
RSI indicator is overbought : over 70
Type : Neutral
Timeframe : Daily
CCI indicator is overbought : over 100
Type : Neutral
Timeframe : Daily
Williams %R indicator is overbought : over -20
Type : Neutral
Timeframe : Daily
Pivot points : price is over resistance 2
Type : Neutral
Timeframe : Weekly
Pivot points : price is over resistance 3
Type : Neutral
Timeframe : Daily
The Central Patterns scanner, which studies chart patterns, resistances and supports, has identified this signal:
Resistance of channel is broken
Type : Bullish
Timeframe : Daily
The Central Candlesticks scanner, specialised in Japanese candlesticks, did not identify any signals.
| S3 | S2 | S1 | Price | |
|---|---|---|---|---|
| ProTrendLines | 467.98 | 525.19 | 599.30 | 605.28 |
| Change (%) | -22.68% | -13.23% | -0.99% | - |
| Change | -137.30 | -80.09 | -5.98 | - |
| Level | Minor | Intermediate | Major | - |
To determine price objectives, it is also possible to use the pivot points. Here is the price position in relation to pivot points:
| Pivot points | S3 | S2 | S1 | PP | R1 | R2 | R3 |
|---|---|---|---|---|---|---|---|
| Standard | 566.82 | 575.91 | 590.60 | 599.69 | 614.38 | 623.47 | 638.16 |
| Camarilla | 598.74 | 600.92 | 603.10 | 605.28 | 607.46 | 609.64 | 611.82 |
| Woodie | 569.61 | 577.31 | 593.39 | 601.09 | 617.17 | 624.87 | 640.95 |
| Fibonacci | 575.91 | 585.00 | 590.61 | 599.69 | 608.78 | 614.39 | 623.47 |
| Pivot points | S3 | S2 | S1 | PP | R1 | R2 | R3 |
|---|---|---|---|---|---|---|---|
| Standard | 482.62 | 499.59 | 532.41 | 549.38 | 582.20 | 599.17 | 631.99 |
| Camarilla | 551.53 | 556.09 | 560.66 | 565.22 | 569.78 | 574.35 | 578.91 |
| Woodie | 490.54 | 503.55 | 540.33 | 553.34 | 590.12 | 603.13 | 639.91 |
| Fibonacci | 499.59 | 518.61 | 530.36 | 549.38 | 568.40 | 580.15 | 599.17 |
| Pivot points | S3 | S2 | S1 | PP | R1 | R2 | R3 |
|---|---|---|---|---|---|---|---|
| Standard | 442.63 | 487.42 | 512.27 | 557.06 | 581.91 | 626.70 | 651.55 |
| Camarilla | 517.98 | 524.36 | 530.75 | 537.13 | 543.51 | 549.90 | 556.28 |
| Woodie | 432.67 | 482.44 | 502.31 | 552.08 | 571.95 | 621.72 | 641.59 |
| Fibonacci | 487.42 | 514.02 | 530.45 | 557.06 | 583.66 | 600.09 | 626.70 |
Numerical data
The following are the details of the technical indicators and moving averages that were collected to generate this technical analysis:
| RSI (14): | 71.35 | |
| MACD (12,26,9): | 6.3700 | |
| Directional Movement: | 19.21 | |
| AROON (14): | 42.86 | |
| DEMA (21): | 567.82 | |
| Parabolic SAR (0,02-0,02-0,2): | 524.01 | |
| Elder Ray (13): | 33.92 | |
| Super Trend (3,10): | 550.05 | |
| Zig ZAG (10): | 605.28 | |
| VORTEX (21): | 0.9700 | |
| Stochastique (14,3,5): | 91.31 | |
| TEMA (21): | 564.40 | |
| Williams %R (14): | -3.81 | |
| Chande Momentum Oscillator (20): | 52.99 | |
| Repulse (5,40,3): | 6.0600 | |
| ROCnROLL: | 1 | |
| TRIX (15,9): | 0.0400 | |
| Courbe Coppock: | 0.76 |
| MA7: | 559.96 | |
| MA20: | 558.77 | |
| MA50: | 547.68 | |
| MA100: | 497.66 | |
| MAexp7: | 570.66 | |
| MAexp20: | 559.98 | |
| MAexp50: | 540.78 | |
| MAexp100: | 504.03 | |
| Price / MA7: | +8.09% | |
| Price / MA20: | +8.32% | |
| Price / MA50: | +10.52% | |
| Price / MA100: | +21.63% | |
| Price / MAexp7: | +6.07% | |
| Price / MAexp20: | +8.09% | |
| Price / MAexp50: | +11.93% | |
| Price / MAexp100: | +20.09% |
News
The last news published on ELI LILLY AND CO. at the time of the generation of this analysis was as follows:
- Baricitinib in Combination with Remdesivir Reduces Time to Recovery in Hospitalized Patients with COVID-19 in NIAID-Sponsored ACTT-2 Trial
- Eli Lilly and Company: Eli Lilly and Company Files 10-Q
- Eli Lilly and Company: Eli Lilly and Company Files 8-K
- Eli Lilly and Company: Eli Lilly and Company Files Form 4
- Eli Lilly and Company: Eli Lilly and Company Files 8-K
About author

Online


Add a comment
Comments
0 comments on the analysis ELI LILLY AND CO. - Daily