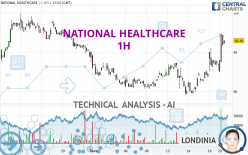
NATIONAL HEALTHCARE - 1H - Technical analysis published on 02/20/2024 (GMT)
- 93
- 0
Click here for a new analysis!
- Timeframe : 1H
- - Analysis generated on
- Status : TARGET REACHED

Summary of the analysis

Additional analysis
Quotes
The NATIONAL HEALTHCARE rating is 96.11 USD. On the day, this instrument gained +2.96% with the lowest point at 92.55 USD and the highest point at 97.36 USD. The deviation from the price is +3.85% for the low point and -1.28% for the high point.The Central Gaps scanner detects a bearish gap which is a sign that the sellers have taken the lead in the very short term.
Opening Gap DOWN
Type : Bearish
Timeframe : Openning
A study of price movements over other periods shows the following variations:
Near a new HIGH record (5 years)
Type : Bullish
Timeframe : Weekly
Near a new HIGH record (1 year)
Type : Bullish
Timeframe : Weekly
Near a new LOW record (1st january)
Type : Bearish
Timeframe : Weekly
Near a new LOW record (1 month)
Type : Bearish
Timeframe : Weekly
The Central Volumes scanner notes the presence of abnormal volumes:
Abnormal volumes
Timeframe : 50 days
Technical
Technical analysis of NATIONAL HEALTHCARE in 1H shows a strongly overall bullish trend. 85.71% of the signals given by moving averages are bullish. This strongly bullish trend is supported by the strong bullish signals given by short-term moving averages. An assessment of moving averages reveals a bullish signal that could impact this trend:
Bullish trend reversal : Moving Average 100
Type : Bullish
Timeframe : 1 hour
In fact, according to the parameters integrated into the Central Analyzer system, 16 technical indicators out of 18 analysed are currently bullish. But beware of excesses. The Central Indicators scanner currently detects this:
CCI indicator is overbought : over 100
Type : Neutral
Timeframe : 1 hour
Previous candle closed over Bollinger bands
Type : Neutral
Timeframe : 1 hour
CCI indicator: bearish divergence
Type : Bearish
Timeframe : 1 hour
Pivot points : price is over resistance 1
Type : Neutral
Timeframe : 1 hour
Price is back over the pivot point
Type : Bullish
Timeframe : Weekly
Central Patterns, the market scanner focusing on chart patterns, resistances and supports found these results:
Near horizontal resistance
Type : Bearish
Timeframe : 1 hour
Resistance of channel is broken
Type : Bullish
Timeframe : 1 hour
Central Candlesticks, the scanner specialised in Japanese candlesticks, detects a bearish signal that could support the hypothesis of a small drop in the very short term:
Bearish harami
Type : Bearish
Timeframe : 1 hour
| S3 | S2 | S1 | Price | R1 | R2 | |
|---|---|---|---|---|---|---|
| ProTrendLines | 92.22 | 93.83 | 95.92 | 96.11 | 98.14 | 99.98 |
| Change (%) | -4.05% | -2.37% | -0.20% | - | +2.11% | +4.03% |
| Change | -3.89 | -2.28 | -0.19 | - | +2.03 | +3.87 |
| Level | Major | Intermediate | Minor | - | Major | Intermediate |
Attention could also be paid to pivot points to set price objectives:
| Pivot points | S3 | S2 | S1 | PP | R1 | R2 | R3 |
|---|---|---|---|---|---|---|---|
| Standard | 89.21 | 90.90 | 92.13 | 93.82 | 95.05 | 96.74 | 97.97 |
| Camarilla | 92.55 | 92.82 | 93.08 | 93.35 | 93.62 | 93.89 | 94.15 |
| Woodie | 88.97 | 90.79 | 91.89 | 93.71 | 94.81 | 96.63 | 97.73 |
| Fibonacci | 90.90 | 92.02 | 92.71 | 93.82 | 94.94 | 95.63 | 96.74 |
| Pivot points | S3 | S2 | S1 | PP | R1 | R2 | R3 |
|---|---|---|---|---|---|---|---|
| Standard | 84.11 | 86.82 | 90.09 | 92.80 | 96.07 | 98.78 | 102.05 |
| Camarilla | 91.71 | 92.25 | 92.80 | 93.35 | 93.90 | 94.45 | 95.00 |
| Woodie | 84.38 | 86.96 | 90.36 | 92.94 | 96.34 | 98.92 | 102.32 |
| Fibonacci | 86.82 | 89.11 | 90.52 | 92.80 | 95.09 | 96.50 | 98.78 |
| Pivot points | S3 | S2 | S1 | PP | R1 | R2 | R3 |
|---|---|---|---|---|---|---|---|
| Standard | 81.84 | 86.85 | 89.95 | 94.96 | 98.06 | 103.07 | 106.17 |
| Camarilla | 90.81 | 91.55 | 92.30 | 93.04 | 93.78 | 94.53 | 95.27 |
| Woodie | 80.88 | 86.37 | 88.99 | 94.48 | 97.10 | 102.59 | 105.21 |
| Fibonacci | 86.85 | 89.95 | 91.87 | 94.96 | 98.06 | 99.98 | 103.07 |
Numerical data
The following are the details of the technical indicators and moving averages that were collected to generate this technical analysis:
| RSI (14): | 64.56 | |
| MACD (12,26,9): | 1.0100 | |
| Directional Movement: | 28.10 | |
| AROON (14): | 85.72 | |
| DEMA (21): | 94.55 | |
| Parabolic SAR (0,02-0,02-0,2): | 92.55 | |
| Elder Ray (13): | 2.48 | |
| Super Trend (3,10): | 92.70 | |
| Zig ZAG (10): | 95.93 | |
| VORTEX (21): | 1.2000 | |
| Stochastique (14,3,5): | 80.32 | |
| TEMA (21): | 95.40 | |
| Williams %R (14): | -23.70 | |
| Chande Momentum Oscillator (20): | 3.47 | |
| Repulse (5,40,3): | 2.5700 | |
| ROCnROLL: | 1 | |
| TRIX (15,9): | 0.1000 | |
| Courbe Coppock: | 7.18 |
| MA7: | 92.74 | |
| MA20: | 93.76 | |
| MA50: | 93.78 | |
| MA100: | 81.97 | |
| MAexp7: | 94.85 | |
| MAexp20: | 93.43 | |
| MAexp50: | 92.63 | |
| MAexp100: | 92.90 | |
| Price / MA7: | +3.63% | |
| Price / MA20: | +2.51% | |
| Price / MA50: | +2.48% | |
| Price / MA100: | +17.25% | |
| Price / MAexp7: | +1.33% | |
| Price / MAexp20: | +2.87% | |
| Price / MAexp50: | +3.76% | |
| Price / MAexp100: | +3.46% |
News
The latest news and videos published on NATIONAL HEALTHCARE at the time of the analysis were as follows:
- Perimeter Medical Imaging AI Announces Expanded Commercial Presence within National Healthcare Provider System with Follow-On Placement of Perimeter S-Series OCT at Additional Hospital Site
- SHAREHOLDER ALERT: Kaskela Law LLC Announces Investigation of National HealthCare Corporation (NYSE: NHC) and Encourages Investors to Contact the Firm
- Perimeter Medical Imaging AI Announces Further Commercial Expansion in North Texas with Follow-On Placement of Perimeter S-Series OCT within National Healthcare Provider System
- Huntridge Family Clinic Reopens Doors With National Healthcare Non-Profit
- NHC Reports Second Quarter 2023 Earnings
About author
Online


Add a comment
Comments
0 comments on the analysis NATIONAL HEALTHCARE - 1H