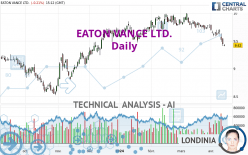
EATON VANCE LTD. - Daily - Technical analysis published on 04/12/2024 (GMT)
- 99
- 0
Click here for a new analysis!
- Timeframe : Daily
- - Analysis generated on
- Status : INVALID

Summary of the analysis

Additional analysis
Quotes
The EATON VANCE LTD. price is 9.42 USD. The price registered a decrease of -0.21% on the session and was between 9.40 USD and 9.44 USD. This implies that the price is at +0.21% from its lowest and at -0.21% from its highest.The Central Gaps scanner detects a bearish opening marking the presence of sellers ahead of buyers at the opening but not sufficiently marked to allow the price to register a quotation gap.
Bearish opening
Type : Bearish
Timeframe : Openning
So that you have an overall view of the price change, here is a table showing the variations over several periods:
Near a new HIGH record (1 year)
Type : Bullish
Timeframe : Weekly
Near a new HIGH record (1st january)
Type : Bullish
Timeframe : Weekly
Near a new HIGH record (1 month)
Type : Bullish
Timeframe : Weekly
New LOW record (1 month)
Type : Bearish
Timeframe : Weekly
Technical
Technical analysis of EATON VANCE LTD. in Daily shows a neutral overall trend. The trend could quickly turn bearish due to the strong bearish signals currently being given by short-term moving averages. The Central Indicators market scanner is currently detecting several bearish signals that could impact this trend:
Bearish trend reversal : Moving Average 50
Type : Bearish
Timeframe : Daily
Bearish price crossover with Moving Average 100
Type : Bearish
Timeframe : Daily
In fact, 13 technical indicators on 18 studied are currently positioned bearish. But beware of excesses. The Central Indicators scanner currently detects this:
CCI indicator is oversold : under -100
Type : Neutral
Timeframe : Daily
Williams %R indicator is oversold : under -80
Type : Neutral
Timeframe : Daily
Pivot points : price is under support 1
Type : Neutral
Timeframe : Weekly
Central Patterns, the market scanner focusing on chart patterns, resistances and supports found these results:
Near horizontal support
Type : Bullish
Timeframe : Daily
Support of channel is broken
Type : Bearish
Timeframe : Daily
The Central Candlesticks scanner currently notes the presence of this pattern in Japanese candlesticks that could mark the end of the short-term trend currently underway:
Doji
Type : Neutral
Timeframe : Daily
| S3 | S2 | S1 | Price | R1 | R2 | R3 | |
|---|---|---|---|---|---|---|---|
| ProTrendLines | 8.37 | 8.96 | 9.27 | 9.42 | 9.46 | 9.62 | 9.83 |
| Change (%) | -11.15% | -4.88% | -1.59% | - | +0.42% | +2.12% | +4.35% |
| Change | -1.05 | -0.46 | -0.15 | - | +0.04 | +0.20 | +0.41 |
| Level | Major | Major | Intermediate | - | Minor | Major | Major |
Pivot points can also be used to set your price objectives. Here is the price situation in relation to pivot points:
| Pivot points | S3 | S2 | S1 | PP | R1 | R2 | R3 |
|---|---|---|---|---|---|---|---|
| Standard | 9.26 | 9.33 | 9.39 | 9.46 | 9.52 | 9.59 | 9.65 |
| Camarilla | 9.40 | 9.42 | 9.43 | 9.44 | 9.45 | 9.46 | 9.48 |
| Woodie | 9.25 | 9.33 | 9.38 | 9.46 | 9.51 | 9.59 | 9.64 |
| Fibonacci | 9.33 | 9.38 | 9.41 | 9.46 | 9.51 | 9.54 | 9.59 |
| Pivot points | S3 | S2 | S1 | PP | R1 | R2 | R3 |
|---|---|---|---|---|---|---|---|
| Standard | 9.24 | 9.37 | 9.45 | 9.58 | 9.66 | 9.79 | 9.87 |
| Camarilla | 9.47 | 9.49 | 9.51 | 9.53 | 9.55 | 9.57 | 9.59 |
| Woodie | 9.22 | 9.36 | 9.43 | 9.57 | 9.64 | 9.78 | 9.85 |
| Fibonacci | 9.37 | 9.45 | 9.50 | 9.58 | 9.66 | 9.71 | 9.79 |
| Pivot points | S3 | S2 | S1 | PP | R1 | R2 | R3 |
|---|---|---|---|---|---|---|---|
| Standard | 9.35 | 9.48 | 9.58 | 9.71 | 9.81 | 9.94 | 10.04 |
| Camarilla | 9.61 | 9.63 | 9.65 | 9.67 | 9.69 | 9.71 | 9.73 |
| Woodie | 9.33 | 9.47 | 9.56 | 9.70 | 9.79 | 9.93 | 10.02 |
| Fibonacci | 9.48 | 9.57 | 9.63 | 9.71 | 9.80 | 9.86 | 9.94 |
Numerical data
The following is the status of the technical indicators and moving averages at the time of publication of this technical analysis:
| RSI (14): | 32.15 | |
| MACD (12,26,9): | -0.0500 | |
| Directional Movement: | -12.20 | |
| AROON (14): | -64.29 | |
| DEMA (21): | 9.53 | |
| Parabolic SAR (0,02-0,02-0,2): | 9.62 | |
| Elder Ray (13): | -0.13 | |
| Super Trend (3,10): | 9.68 | |
| Zig ZAG (10): | 9.41 | |
| VORTEX (21): | 0.7700 | |
| Stochastique (14,3,5): | 8.82 | |
| TEMA (21): | 9.46 | |
| Williams %R (14): | -100.00 | |
| Chande Momentum Oscillator (20): | -0.22 | |
| Repulse (5,40,3): | -1.3100 | |
| ROCnROLL: | 2 | |
| TRIX (15,9): | -0.0400 | |
| Courbe Coppock: | 3.53 |
| MA7: | 9.52 | |
| MA20: | 9.60 | |
| MA50: | 9.65 | |
| MA100: | 9.43 | |
| MAexp7: | 9.50 | |
| MAexp20: | 9.58 | |
| MAexp50: | 9.57 | |
| MAexp100: | 9.41 | |
| Price / MA7: | -1.05% | |
| Price / MA20: | -1.88% | |
| Price / MA50: | -2.38% | |
| Price / MA100: | -0.11% | |
| Price / MAexp7: | -0.84% | |
| Price / MAexp20: | -1.67% | |
| Price / MAexp50: | -1.57% | |
| Price / MAexp100: | +0.11% |
About author
Online


Add a comment
Comments
0 comments on the analysis EATON VANCE LTD. - Daily