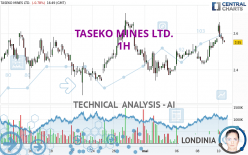
TASEKO MINES LTD. - 1H - Technical analysis published on 05/10/2024 (GMT)
- 90
- 0
Click here for a new analysis!
- Timeframe : 1H
- - Analysis generated on
- Status : TARGET REACHED

Summary of the analysis

Additional analysis
Quotes
The TASEKO MINES LTD. price is 2.56 USD. On the day, this instrument lost -0.39% with the lowest point at 2.54 USD and the highest point at 2.66 USD. The deviation from the price is +0.79% for the low point and -3.76% for the high point.A bullish gap was detected at the opening by the Central Gaps scanner. There are a lot of buyers and they have the upper hand in the very short term.
Opening Gap UP
Type : Bullish
Timeframe : Openning
A study of price movements over other periods shows the following variations:
Near a new HIGH record (5 years)
Type : Bullish
Timeframe : Weekly
Near a new HIGH record (1 year)
Type : Bullish
Timeframe : Weekly
Near a new HIGH record (1st january)
Type : Bullish
Timeframe : Weekly
Near a new HIGH record (1 month)
Type : Bullish
Timeframe : Weekly
Abnormal volumes on TASEKO MINES LTD. were detected by the Central Volumes scanner:
Abnormal volumes
Timeframe : 20 days
Abnormal volumes
Timeframe : 50 days
Technical
A technical analysis in 1H of this TASEKO MINES LTD. chart shows a strongly bullish trend. 89.29% of the signals given by moving averages are bullish. The overall trend is supported by the strong bullish signals from short-term moving averages. The Central Indicators scanner detects a bullish signal on moving averages that could impact this trend:
Moving Average bullish crossovers : MA50 & MA100
Type : Bullish
Timeframe : 1 hour
The probability of a further increase are moderate given the direction of the technical indicators.
Central Indicators, the detector scanner for these technical indicators recently detected a signal:
Price is back over the pivot point
Type : Bullish
Timeframe : Weekly
An analysis of the price chart with the Central Patterns scanner (detector of chart patterns and resistances and supports) shows several results that can have an impact on the price change:
Near horizontal resistance
Type : Bearish
Timeframe : 1 hour
Resistance of channel is broken
Type : Bullish
Timeframe : 1 hour
For a small setback in the very short term, the Central Candlesticks scanner currently notes the presence of this bearish pattern in Japanese candlesticks:
Three black crows
Type : Bearish
Timeframe : 1 hour
| S3 | S2 | S1 | Price | R1 | R2 | R3 | |
|---|---|---|---|---|---|---|---|
| ProTrendLines | 2.15 | 2.34 | 2.39 | 2.56 | 2.62 | 2.71 | 3.51 |
| Change (%) | -16.02% | -8.59% | -6.64% | - | +2.34% | +5.86% | +37.11% |
| Change | -0.41 | -0.22 | -0.17 | - | +0.06 | +0.15 | +0.95 |
| Level | Minor | Major | Major | - | Major | Intermediate | Minor |
Attention could also be paid to pivot points to set price objectives:
| Pivot points | S3 | S2 | S1 | PP | R1 | R2 | R3 |
|---|---|---|---|---|---|---|---|
| Standard | 2.37 | 2.41 | 2.49 | 2.53 | 2.61 | 2.65 | 2.73 |
| Camarilla | 2.54 | 2.55 | 2.56 | 2.57 | 2.58 | 2.59 | 2.60 |
| Woodie | 2.39 | 2.42 | 2.51 | 2.54 | 2.63 | 2.66 | 2.75 |
| Fibonacci | 2.41 | 2.46 | 2.48 | 2.53 | 2.58 | 2.60 | 2.65 |
| Pivot points | S3 | S2 | S1 | PP | R1 | R2 | R3 |
|---|---|---|---|---|---|---|---|
| Standard | 1.89 | 2.12 | 2.26 | 2.49 | 2.63 | 2.86 | 3.00 |
| Camarilla | 2.31 | 2.34 | 2.38 | 2.41 | 2.44 | 2.48 | 2.51 |
| Woodie | 1.86 | 2.10 | 2.23 | 2.47 | 2.60 | 2.84 | 2.97 |
| Fibonacci | 2.12 | 2.26 | 2.35 | 2.49 | 2.63 | 2.72 | 2.86 |
| Pivot points | S3 | S2 | S1 | PP | R1 | R2 | R3 |
|---|---|---|---|---|---|---|---|
| Standard | 1.59 | 1.87 | 2.16 | 2.44 | 2.73 | 3.01 | 3.30 |
| Camarilla | 2.30 | 2.36 | 2.41 | 2.46 | 2.51 | 2.57 | 2.62 |
| Woodie | 1.61 | 1.87 | 2.18 | 2.44 | 2.75 | 3.01 | 3.32 |
| Fibonacci | 1.87 | 2.08 | 2.22 | 2.44 | 2.65 | 2.79 | 3.01 |
Numerical data
The following is the status of technical indicators and moving averages registered at the time this technical analysis was created:
| RSI (14): | 58.47 | |
| MACD (12,26,9): | 0.0300 | |
| Directional Movement: | 16.12 | |
| AROON (14): | 78.57 | |
| DEMA (21): | 2.57 | |
| Parabolic SAR (0,02-0,02-0,2): | 2.50 | |
| Elder Ray (13): | 0.01 | |
| Super Trend (3,10): | 2.52 | |
| Zig ZAG (10): | 2.57 | |
| VORTEX (21): | 0.9900 | |
| Stochastique (14,3,5): | 62.32 | |
| TEMA (21): | 2.59 | |
| Williams %R (14): | -41.30 | |
| Chande Momentum Oscillator (20): | 0.12 | |
| Repulse (5,40,3): | -1.6200 | |
| ROCnROLL: | 1 | |
| TRIX (15,9): | 0.1300 | |
| Courbe Coppock: | 8.50 |
| MA7: | 2.49 | |
| MA20: | 2.47 | |
| MA50: | 2.22 | |
| MA100: | 1.82 | |
| MAexp7: | 2.57 | |
| MAexp20: | 2.53 | |
| MAexp50: | 2.50 | |
| MAexp100: | 2.47 | |
| Price / MA7: | +2.81% | |
| Price / MA20: | +3.64% | |
| Price / MA50: | +15.32% | |
| Price / MA100: | +40.66% | |
| Price / MAexp7: | -0.39% | |
| Price / MAexp20: | +1.19% | |
| Price / MAexp50: | +2.40% | |
| Price / MAexp100: | +3.64% |
News
The last news published on TASEKO MINES LTD. at the time of the generation of this analysis was as follows:
- Taseko Mines Limited - Taseko Reports First Quarter 2024 Operational Performance and $50 Million of Adjusted EBITDA
- Taseko Reports First Quarter 2024 Operational Performance and $50 Million of Adjusted EBITDA
- Taseko Mines Limited - Taseko Mines Completes Notes Offering
- TASEKO MINES COMPLETES NOTES OFFERING
- Taseko Mines Limited - Taseko Announces Pricing of SR Secured Notes
About author
Online


Add a comment
Comments
0 comments on the analysis TASEKO MINES LTD. - 1H