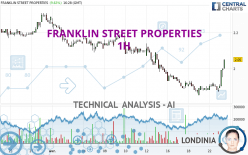
FRANKLIN STREET PROPERTIES - 1H - Technical analysis published on 04/23/2024 (GMT)
- 94
- 0
Click here for a new analysis!
- Timeframe : 1H
- - Analysis generated on
- Status : INVALID

Summary of the analysis

Additional analysis
Quotes
The FRANKLIN STREET PROPERTIES rating is 2.03 USD. The price has increased by +8.56% since the last closing and was traded between 1.89 USD and 2.03 USD over the period. The price is currently at +7.41% from its lowest and 0% from its highest.The Central Gaps scanner detects a bullish opening marking the presence of buyers ahead of sellers at the opening but not sufficiently marked to allow the price to register a quotation gap.
Bullish opening
Type : Bullish
Timeframe : Openning
A study of price movements over other periods shows the following variations:
Near a new LOW record (1st january)
Type : Bearish
Timeframe : Weekly
Near a new LOW record (1 month)
Type : Bearish
Timeframe : Weekly
Technical
Technical analysis of FRANKLIN STREET PROPERTIES in 1H shows an overall slightly bearish trend. Only 50.00% of the signals given by moving averages are bearish. This slightly bearish trend could quickly be reversed due to the strong bullish signals currently being given by short-term moving averages. An assessment of moving averages reveals a bullish signal that could impact this trend:
Bullish price crossover with Moving Average 100
Type : Bullish
Timeframe : 1 hour
In fact, according to the parameters integrated into the Central Analyzer system, 15 technical indicators out of 18 analysed are currently bullish. But beware of excesses. The Central Indicators scanner currently detects this:
CCI indicator is overbought : over 100
Type : Neutral
Timeframe : 1 hour
Previous candle closed over Bollinger bands
Type : Neutral
Timeframe : 1 hour
Williams %R indicator is overbought : over -20
Type : Neutral
Timeframe : 1 hour
Pivot points : price is over resistance 1
Type : Neutral
Timeframe : Weekly
Pivot points : price is over resistance 3
Type : Neutral
Timeframe : 1 hour
The Central Patterns scanner, which studies chart patterns, resistances and supports, has identified these signals:
Near horizontal resistance
Type : Bearish
Timeframe : 1 hour
Resistance of channel is broken
Type : Bullish
Timeframe : 1 hour
No result was found by the Central Candlesticks scanner on Japanese candlesticks.
| S3 | S2 | S1 | Price | R1 | R2 | R3 | |
|---|---|---|---|---|---|---|---|
| ProTrendLines | 1.85 | 1.92 | 1.98 | 2.03 | 2.11 | 2.18 | 2.30 |
| Change (%) | -8.87% | -5.42% | -2.46% | - | +3.94% | +7.39% | +13.30% |
| Change | -0.18 | -0.11 | -0.05 | - | +0.08 | +0.15 | +0.27 |
| Level | Intermediate | Minor | Minor | - | Minor | Major | Minor |
Attention could also be paid to pivot points to set price objectives:
| Pivot points | S3 | S2 | S1 | PP | R1 | R2 | R3 |
|---|---|---|---|---|---|---|---|
| Standard | 1.80 | 1.84 | 1.85 | 1.89 | 1.90 | 1.94 | 1.95 |
| Camarilla | 1.86 | 1.86 | 1.87 | 1.87 | 1.88 | 1.88 | 1.88 |
| Woodie | 1.80 | 1.83 | 1.85 | 1.88 | 1.90 | 1.93 | 1.95 |
| Fibonacci | 1.84 | 1.86 | 1.87 | 1.89 | 1.91 | 1.92 | 1.94 |
| Pivot points | S3 | S2 | S1 | PP | R1 | R2 | R3 |
|---|---|---|---|---|---|---|---|
| Standard | 1.58 | 1.71 | 1.80 | 1.93 | 2.02 | 2.15 | 2.24 |
| Camarilla | 1.82 | 1.84 | 1.86 | 1.88 | 1.90 | 1.92 | 1.94 |
| Woodie | 1.55 | 1.70 | 1.77 | 1.92 | 1.99 | 2.14 | 2.21 |
| Fibonacci | 1.71 | 1.80 | 1.85 | 1.93 | 2.02 | 2.07 | 2.15 |
| Pivot points | S3 | S2 | S1 | PP | R1 | R2 | R3 |
|---|---|---|---|---|---|---|---|
| Standard | 1.82 | 1.95 | 2.11 | 2.24 | 2.40 | 2.53 | 2.69 |
| Camarilla | 2.18 | 2.21 | 2.23 | 2.26 | 2.29 | 2.31 | 2.34 |
| Woodie | 1.83 | 1.96 | 2.12 | 2.25 | 2.41 | 2.54 | 2.70 |
| Fibonacci | 1.95 | 2.06 | 2.13 | 2.24 | 2.35 | 2.42 | 2.53 |
Numerical data
The following are the details of the technical indicators and moving averages that were collected to generate this technical analysis:
| RSI (14): | 60.33 | |
| MACD (12,26,9): | 0.0000 | |
| Directional Movement: | 20.71 | |
| AROON (14): | 14.29 | |
| DEMA (21): | 1.91 | |
| Parabolic SAR (0,02-0,02-0,2): | 1.87 | |
| Elder Ray (13): | 0.05 | |
| Super Trend (3,10): | 1.88 | |
| Zig ZAG (10): | 1.98 | |
| VORTEX (21): | 1.0600 | |
| Stochastique (14,3,5): | 86.67 | |
| TEMA (21): | 1.94 | |
| Williams %R (14): | -3.85 | |
| Chande Momentum Oscillator (20): | 0.10 | |
| Repulse (5,40,3): | 5.4200 | |
| ROCnROLL: | 1 | |
| TRIX (15,9): | -0.0700 | |
| Courbe Coppock: | 4.23 |
| MA7: | 1.91 | |
| MA20: | 2.06 | |
| MA50: | 2.19 | |
| MA100: | 2.34 | |
| MAexp7: | 1.96 | |
| MAexp20: | 1.91 | |
| MAexp50: | 1.94 | |
| MAexp100: | 2.01 | |
| Price / MA7: | +6.28% | |
| Price / MA20: | -1.46% | |
| Price / MA50: | -7.31% | |
| Price / MA100: | -13.25% | |
| Price / MAexp7: | +3.57% | |
| Price / MAexp20: | +6.28% | |
| Price / MAexp50: | +4.64% | |
| Price / MAexp100: | +1.00% |
News
The latest news and videos published on FRANKLIN STREET PROPERTIES at the time of the analysis were as follows:
- Franklin Street Properties Corp. Announces Second Quarter 2023 Results
- Franklin Street Properties Corp. to Announce Second Quarter 2023 Results
- Franklin Street Properties Corp. Declares Quarterly Dividend
- Franklin Street Properties Corp. Announces Leasing Activity
- Franklin Street Properties Corp. Announces First Quarter 2023 Results
About author
Online


Add a comment
Comments
0 comments on the analysis FRANKLIN STREET PROPERTIES - 1H