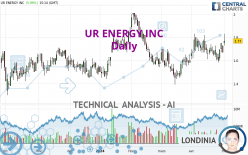
UR ENERGY INC - Daily - Technical analysis published on 05/01/2024 (GMT)
- 64
- 0
Click here for a new analysis!
- Timeframe : Daily
- - Analysis generated on
- Status : INVALID

Summary of the analysis

Additional analysis
Quotes
UR ENERGY INC rating 1.77 USD. The price registered an increase of +5.99% on the session and was traded between 1.73 USD and 1.83 USD over the period. The price is currently at +2.31% from its lowest and -3.28% from its highest.A bullish gap was detected at the opening by the Central Gaps scanner. There are a lot of buyers and they have the upper hand in the very short term.
Opening Gap UP
Type : Bullish
Timeframe : Openning
So that you have an overall view of the price change, here is a table showing the variations over several periods:
New HIGH record (1 month)
Type : Bullish
Timeframe : Weekly
Technical
Technical analysis of this Daily chart of UR ENERGY INC indicates that the overall trend is strongly bullish. 89.29% of the signals given by moving averages are bullish. The overall trend is supported by the strong bullish signals from short-term moving averages. The Central Indicators scanner detects a bullish signal on moving averages that could impact this trend:
Bullish price crossover with Moving Average 20
Type : Bullish
Timeframe : Daily
In fact, according to the parameters integrated into the Central Analyzer system, 15 technical indicators out of 18 analysed are currently bullish. Caution: the Central Indicators scanner currently detects an excess:
CCI indicator is overbought : over 100
Type : Neutral
Timeframe : Daily
Williams %R indicator is overbought : over -20
Type : Neutral
Timeframe : Daily
Pivot points : price is over resistance 1
Type : Neutral
Timeframe : Weekly
Pivot points : price is over resistance 3
Type : Neutral
Timeframe : Daily
RSI indicator is back over 50
Type : Bullish
Timeframe : Daily
MACD crosses UP its Moving Average
Type : Bullish
Timeframe : Daily
Aroon indicator bullish trend
Type : Bullish
Timeframe : Daily
Ichimoku : price is over the cloud
Type : Bullish
Timeframe : Daily
Ichimoku - Bullish crossover : Tenkan & Kijun
Type : Bullish
Timeframe : Daily
Momentum indicator is back over 0
Type : Bullish
Timeframe : Daily
The Central Patterns scanner, which studies chart patterns, resistances and supports, has identified these signals:
Near horizontal resistance
Type : Bearish
Timeframe : Daily
Resistance of channel is broken
Type : Bullish
Timeframe : Daily
The Central Candlesticks scanner, specialised in Japanese candlesticks, did not identify any signals.
| S3 | S2 | S1 | Price | R1 | R2 | R3 | |
|---|---|---|---|---|---|---|---|
| ProTrendLines | 1.18 | 1.47 | 1.73 | 1.77 | 1.88 | 2.01 | 2.10 |
| Change (%) | -33.33% | -16.95% | -2.26% | - | +6.21% | +13.56% | +18.64% |
| Change | -0.59 | -0.30 | -0.04 | - | +0.11 | +0.24 | +0.33 |
| Level | Minor | Major | Major | - | Minor | Minor | Intermediate |
Pivot points can also be used to set your price objectives. Here is the price situation in relation to pivot points:
| Pivot points | S3 | S2 | S1 | PP | R1 | R2 | R3 |
|---|---|---|---|---|---|---|---|
| Standard | 1.57 | 1.62 | 1.64 | 1.69 | 1.71 | 1.76 | 1.78 |
| Camarilla | 1.65 | 1.66 | 1.66 | 1.67 | 1.68 | 1.68 | 1.69 |
| Woodie | 1.57 | 1.61 | 1.64 | 1.68 | 1.71 | 1.75 | 1.78 |
| Fibonacci | 1.62 | 1.64 | 1.66 | 1.69 | 1.71 | 1.73 | 1.76 |
| Pivot points | S3 | S2 | S1 | PP | R1 | R2 | R3 |
|---|---|---|---|---|---|---|---|
| Standard | 1.45 | 1.52 | 1.60 | 1.67 | 1.75 | 1.82 | 1.90 |
| Camarilla | 1.65 | 1.66 | 1.68 | 1.69 | 1.70 | 1.72 | 1.73 |
| Woodie | 1.47 | 1.52 | 1.62 | 1.67 | 1.77 | 1.82 | 1.92 |
| Fibonacci | 1.52 | 1.57 | 1.61 | 1.67 | 1.72 | 1.76 | 1.82 |
| Pivot points | S3 | S2 | S1 | PP | R1 | R2 | R3 |
|---|---|---|---|---|---|---|---|
| Standard | 1.31 | 1.44 | 1.56 | 1.69 | 1.81 | 1.94 | 2.06 |
| Camarilla | 1.60 | 1.62 | 1.65 | 1.67 | 1.69 | 1.72 | 1.74 |
| Woodie | 1.30 | 1.44 | 1.55 | 1.69 | 1.80 | 1.94 | 2.05 |
| Fibonacci | 1.44 | 1.54 | 1.60 | 1.69 | 1.79 | 1.85 | 1.94 |
Numerical data
The following is the status of the technical indicators and moving averages at the time of publication of this technical analysis:
| RSI (14): | 59.19 | |
| MACD (12,26,9): | 0.0200 | |
| Directional Movement: | 17.01 | |
| AROON (14): | 28.57 | |
| DEMA (21): | 1.71 | |
| Parabolic SAR (0,02-0,02-0,2): | 1.59 | |
| Elder Ray (13): | 0.08 | |
| Super Trend (3,10): | 1.50 | |
| Zig ZAG (10): | 1.80 | |
| VORTEX (21): | 1.0100 | |
| Stochastique (14,3,5): | 63.44 | |
| TEMA (21): | 1.72 | |
| Williams %R (14): | -20.00 | |
| Chande Momentum Oscillator (20): | 0.09 | |
| Repulse (5,40,3): | 2.7600 | |
| ROCnROLL: | 1 | |
| TRIX (15,9): | 0.1500 | |
| Courbe Coppock: | 2.36 |
| MA7: | 1.69 | |
| MA20: | 1.70 | |
| MA50: | 1.63 | |
| MA100: | 1.65 | |
| MAexp7: | 1.71 | |
| MAexp20: | 1.69 | |
| MAexp50: | 1.66 | |
| MAexp100: | 1.63 | |
| Price / MA7: | +4.73% | |
| Price / MA20: | +4.12% | |
| Price / MA50: | +8.59% | |
| Price / MA100: | +7.27% | |
| Price / MAexp7: | +3.51% | |
| Price / MAexp20: | +4.73% | |
| Price / MAexp50: | +6.63% | |
| Price / MAexp100: | +8.59% |
News
The latest news and videos published on UR ENERGY INC at the time of the analysis were as follows:
- Ur-Energy to Hold 2024 Q1 Earnings Webcast and Teleconference
- Ur-Energy Provides 2024 Q1 Operations and 2024 Production Guidance Updates
- Ur-Energy Announces Appointment of New Board Members: John Paul Pressey and Elmer W. Dyke
- Ur-Energy Announces Appointment of Vice President Regulatory Affairs
- Ur-Energy Announces Decision to Build Out Shirley Basin Mine
About author
Online


Add a comment
Comments
0 comments on the analysis UR ENERGY INC - Daily