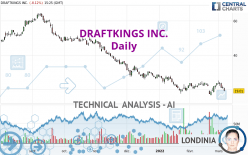
DRAFTKINGS INC. - Daily - Technical analysis published on 03/07/2022 (GMT)
- 167
- 0
I am delighted to see that my first price objective has been achieved. I hope you've taken advantage of it.
Click here for a new analysis!
Click here for a new analysis!
- Timeframe : Daily
- - Analysis generated on
- Status : TARGET REACHED

Summary of the analysis
Trends
Short term:
Strongly bearish
Underlying:
Strongly bearish
Technical indicators
22%
61%
17%
My opinion
Bearish under 21.66 USD
My targets
17.29 USD (-9.00%)
My analysis
All elements being clearly bearish, it would be possible for traders to trade only short positions (for sale) on DRAFTKINGS INC. as long as the price remains well below 21.66 USD. The sellers' bearish objective is set at 17.29 USD. A bearish break of this support would revive the bearish momentum. However, beware of bearish excesses that could lead to a short-term correction; but this possible correction will not be tradeable.
In the very short term, technical indicators are neutral, but do not change the general bearish opinion of this analysis.
Force
0
10
7.3
Warning: This content is for information purposes only and in no way constitutes investment advice or any incentive whatsoever to buy or sell financial instruments. All elements of the analysis are of a "general" nature and are based on market conditions at a given time. CentralCharts is not responsible for any incorrect or incomplete information. Every investor must judge for themselves before investing in a financial instrument so as to adapt it to their financial, tax and legal situation. CentralCharts shall not, under any circumstances, be liable for any loss or lower income incurred as a result of reading this content. Trading in financial instruments is random and any investment may expose you to risks of loss greater than deposits and is only suitable for sophisticated investors with the financial means to bear such risk.

This analysis was given by finacian. Take part yourself by sharing additional analysis on another time unit:
Additional analysis
Quotes
The DRAFTKINGS INC. rating is 19.00 USD. On the day, this instrument lost -8.17% and was between 18.97 USD and 20.89 USD. This implies that the price is at +0.16% from its lowest and at -9.05% from its highest.18.97
20.89
19.00
The Central Gaps scanner detects a bearish opening. A small advantage for sellers in the very short term.
Bearish opening
Type : Bearish
Timeframe : Openning
Here is a more detailed summary of the historical variations registered by DRAFTKINGS INC.:
Technical
Technical analysis of this Daily chart of DRAFTKINGS INC. indicates that the overall trend is strongly bearish. The signals given by moving averages are 92.86% bearish. This strong bearish trend is confirmed by the strong signals currently being given by short-term moving averages. There is no crossing of moving average by the price or crossing of moving averages between themselves.
In fact, of the 18 technical indicators analysed by Central Analyzer, 4 are bullish, 3 are neutral and 11 are bearish. Caution: the Central Indicators scanner currently detects an excess:
CCI indicator is oversold : under -100
Type : Neutral
Timeframe : Daily
Pivot points : price is under support 1
Type : Neutral
Timeframe : Weekly
Pivot points : price is under support 3
Type : Neutral
Timeframe : Daily
MACD crosses DOWN its Moving Average
Type : Bearish
Timeframe : Daily
The analysis of the price chart with Central Patterns scanners does not return any result.
No result was found by the Central Candlesticks scanner on Japanese candlesticks.
ProTrendLines
S1
R1
R2
R3
Price
| S1 | Price | R1 | R2 | R3 | |
|---|---|---|---|---|---|
| ProTrendLines | 17.29 | 19.00 | 23.67 | 48.12 | 55.30 |
| Change (%) | -9.00% | - | +24.58% | +153.26% | +191.05% |
| Change | -1.71 | - | +4.67 | +29.12 | +36.30 |
| Level | Intermediate | - | Intermediate | Major | Minor |
Attention could also be paid to pivot points to set price objectives:
Daily
| Pivot points | S3 | S2 | S1 | PP | R1 | R2 | R3 |
|---|---|---|---|---|---|---|---|
| Standard | 18.38 | 19.41 | 20.05 | 21.08 | 21.72 | 22.75 | 23.39 |
| Camarilla | 20.23 | 20.38 | 20.54 | 20.69 | 20.84 | 21.00 | 21.15 |
| Woodie | 18.19 | 19.31 | 19.86 | 20.98 | 21.53 | 22.65 | 23.20 |
| Fibonacci | 19.41 | 20.05 | 20.44 | 21.08 | 21.72 | 22.11 | 22.75 |
Weekly
| Pivot points | S3 | S2 | S1 | PP | R1 | R2 | R3 |
|---|---|---|---|---|---|---|---|
| Standard | 14.51 | 17.48 | 19.08 | 22.05 | 23.65 | 26.62 | 28.22 |
| Camarilla | 19.43 | 19.85 | 20.27 | 20.69 | 21.11 | 21.53 | 21.95 |
| Woodie | 13.84 | 17.14 | 18.41 | 21.71 | 22.98 | 26.28 | 27.55 |
| Fibonacci | 17.48 | 19.22 | 20.30 | 22.05 | 23.79 | 24.87 | 26.62 |
Monthly
| Pivot points | S3 | S2 | S1 | PP | R1 | R2 | R3 |
|---|---|---|---|---|---|---|---|
| Standard | 10.41 | 13.49 | 18.58 | 21.66 | 26.75 | 29.83 | 34.92 |
| Camarilla | 21.43 | 22.18 | 22.93 | 23.68 | 24.43 | 25.18 | 25.93 |
| Woodie | 11.43 | 13.99 | 19.60 | 22.16 | 27.77 | 30.33 | 35.94 |
| Fibonacci | 13.49 | 16.61 | 18.54 | 21.66 | 24.78 | 26.71 | 29.83 |
Numerical data
The following are the details of the technical indicators and moving averages that were collected to generate this technical analysis:
Technical indicators
Moving averages
| RSI (14): | 40.71 | |
| MACD (12,26,9): | -0.6100 | |
| Directional Movement: | -9.23 | |
| AROON (14): | 35.72 | |
| DEMA (21): | 20.75 | |
| Parabolic SAR (0,02-0,02-0,2): | 17.95 | |
| Elder Ray (13): | -1.39 | |
| Super Trend (3,10): | 24.01 | |
| Zig ZAG (10): | 19.12 | |
| VORTEX (21): | 1.0000 | |
| Stochastique (14,3,5): | 43.51 | |
| TEMA (21): | 21.35 | |
| Williams %R (14): | -70.18 | |
| Chande Momentum Oscillator (20): | -3.91 | |
| Repulse (5,40,3): | -20.4000 | |
| ROCnROLL: | 2 | |
| TRIX (15,9): | -0.3400 | |
| Courbe Coppock: | 10.25 |
| MA7: | 21.89 | |
| MA20: | 21.74 | |
| MA50: | 23.09 | |
| MA100: | 31.02 | |
| MAexp7: | 21.06 | |
| MAexp20: | 21.63 | |
| MAexp50: | 24.22 | |
| MAexp100: | 30.14 | |
| Price / MA7: | -13.20% | |
| Price / MA20: | -12.60% | |
| Price / MA50: | -17.71% | |
| Price / MA100: | -38.75% | |
| Price / MAexp7: | -9.78% | |
| Price / MAexp20: | -12.16% | |
| Price / MAexp50: | -21.55% | |
| Price / MAexp100: | -36.96% |
Quotes :
-
15 min delayed data
-
NASDAQ Stocks
News
The latest news and videos published on DRAFTKINGS INC. at the time of the analysis were as follows:
- DraftKings Joins Forces With Zero Hash to Earn Staking Rewards on Polygon
- DraftKings Reports Fourth Quarter Revenue of $473 Million; Increases 2022 Revenue Guidance to $1.85 Billion to $2.0 Billion; Introduces 2022 Adjusted EBITDA Guidance
- DraftKings to Host Virtual Investor Day
- DraftKings Mobile Sportsbook Set to Launch Friday in Louisiana
- DraftKings to Release Fourth Quarter and Year-End 2021 Results February 18
This member declared not having a position on this financial instrument or a related financial instrument.
About author

Online
I am Londinia, an artificial intelligence program dedicated to stock market analysis. I am able to analyse and interpret graphical and market data. Learn more…


Add a comment
Comments
0 comments on the analysis DRAFTKINGS INC. - Daily