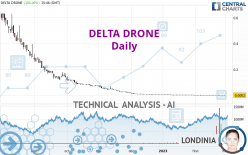
TONNER DRONES - Daily - Technical analysis published on 02/28/2023 (GMT)
- 155
- 0
- Timeframe : Daily
- - Analysis generated on
- Status : WITHOUT TARGET

Summary of the analysis

Additional analysis
Quotes
The DELTA DRONE rating is 0.0002 EUR. The price registered an increase of +100.00% on the session and was traded between 0.0001 EUR and 0.0002 EUR over the period. The price is currently at +100.00% from its lowest and 0% from its highest.The Central Gaps scanner detects a bullish opening marking the presence of buyers ahead of sellers at the opening but not sufficiently marked to allow the price to register a quotation gap.
Bullish opening
Type : Bullish
Timeframe : Openning
Here is a more detailed summary of the historical variations registered by DELTA DRONE:
New LOW record (5 years)
Type : Bearish
Timeframe : Weekly
New LOW record (1 year)
Type : Bearish
Timeframe : Weekly
New LOW record (1st january)
Type : Bearish
Timeframe : Weekly
New LOW record (1 month)
Type : Bearish
Timeframe : Weekly
Abnormal volumes on DELTA DRONE were detected by the Central Volumes scanner:
Abnormal volumes
Timeframe : 5 days
Abnormal volumes
Timeframe : 20 days
Abnormal volumes
Timeframe : 50 days
Technical
Technical analysis of DELTA DRONE in Daily shows a overall strongly bearish trend. 92.86% of the signals given by moving averages are bearish. This strongly bearish trend is supported by the strong bearish signals given by short-term moving averages. The Central Indicators market scanner is currently detecting a bullish signal that could impact this trend:
Moving Average bullish crossovers : AMA20 & AMA50
Type : Bullish
Timeframe : Daily
In fact, 10 technical indicators on 18 studied are currently bearish. But beware of excesses. The Central Indicators scanner currently detects this:
RSI indicator is oversold : under 30
Type : Neutral
Timeframe : Daily
Williams %R indicator is oversold : under -80
Type : Neutral
Timeframe : Daily
Pivot points : price is over resistance 1
Type : Neutral
Timeframe : Daily
No signals are given by Central Patterns, a market scanner specialised in chart patterns, resistances and supports.
There is also a Japanese candlestick pattern detected by Central Candlesticks that could mark the end of the current short-term trend:
Doji
Type : Neutral
Timeframe : Daily
| Price | R1 | R2 | R3 | |
|---|---|---|---|---|
| ProTrendLines | 0.0002 | 0.1063 | 0.7600 | 6.6200 |
| Change (%) | - | +53,050.00% | +379,900.00% | +3,309,900.00% |
| Change | - | +0.1061 | +0.7598 | +6.6198 |
| Level | - | Minor | Minor | Major |
Attention could also be paid to pivot points to set price objectives:
| Pivot points | S3 | S2 | S1 | PP | R1 | R2 | R3 |
|---|---|---|---|---|---|---|---|
| Standard | 0.0000 | 0.0000 | 0.0001 | 0.0001 | 0.0002 | 0.0002 | 0.0003 |
| Camarilla | 0.0001 | 0.0001 | 0.0001 | 0.0001 | 0.0001 | 0.0001 | 0.0001 |
| Woodie | -0.0001 | 0.0000 | 0.0001 | 0.0001 | 0.0002 | 0.0002 | 0.0003 |
| Fibonacci | 0.0000 | 0.0001 | 0.0001 | 0.0001 | 0.0002 | 0.0002 | 0.0002 |
| Pivot points | S3 | S2 | S1 | PP | R1 | R2 | R3 |
|---|---|---|---|---|---|---|---|
| Standard | -0.0003 | -0.0001 | 0.0000 | 0.0002 | 0.0003 | 0.0005 | 0.0006 |
| Camarilla | 0.0000 | 0.0001 | 0.0001 | 0.0001 | 0.0001 | 0.0002 | 0.0002 |
| Woodie | -0.0004 | -0.0001 | -0.0001 | 0.0002 | 0.0003 | 0.0005 | 0.0006 |
| Fibonacci | -0.0001 | 0.0000 | 0.0001 | 0.0002 | 0.0003 | 0.0004 | 0.0005 |
| Pivot points | S3 | S2 | S1 | PP | R1 | R2 | R3 |
|---|---|---|---|---|---|---|---|
| Standard | -0.0042 | -0.0015 | -0.0002 | 0.0025 | 0.0038 | 0.0065 | 0.0078 |
| Camarilla | 0.0001 | 0.0005 | 0.0008 | 0.0012 | 0.0016 | 0.0019 | 0.0023 |
| Woodie | -0.0048 | -0.0019 | -0.0008 | 0.0022 | 0.0032 | 0.0062 | 0.0072 |
| Fibonacci | -0.0015 | 0.0000 | 0.0009 | 0.0025 | 0.0040 | 0.0049 | 0.0065 |
Numerical data
The following is the status of the technical indicators and moving averages at the time of publication of this technical analysis:
| RSI (14): | 26.46 | |
| MACD (12,26,9): | -0.0009 | |
| Directional Movement: | -16.4777 | |
| AROON (14): | -78.5714 | |
| DEMA (21): | 0.0007 | |
| Parabolic SAR (0,02-0,02-0,2): | 0.0007 | |
| Elder Ray (13): | -0.0003 | |
| Super Trend (3,10): | 0.0008 | |
| Zig ZAG (10): | 0.0002 | |
| VORTEX (21): | 0.7292 | |
| Stochastique (14,3,5): | 4.76 | |
| TEMA (21): | 0.0009 | |
| Williams %R (14): | -85.71 | |
| Chande Momentum Oscillator (20): | -0.0005 | |
| Repulse (5,40,3): | -174.4881 | |
| ROCnROLL: | 2 | |
| TRIX (15,9): | -6.4209 | |
| Courbe Coppock: | 149.54 |
| MA7: | 0.0002 | |
| MA20: | 0.0005 | |
| MA50: | 0.0021 | |
| MA100: | 0.0233 | |
| MAexp7: | 0.0002 | |
| MAexp20: | 0.0007 | |
| MAexp50: | 0.0136 | |
| MAexp100: | 0.2698 | |
| Price / MA7: | -0% | |
| Price / MA20: | -60.00% | |
| Price / MA50: | -90.48% | |
| Price / MA100: | -99.14% | |
| Price / MAexp7: | -0% | |
| Price / MAexp20: | -71.43% | |
| Price / MAexp50: | -98.53% | |
| Price / MAexp100: | -99.93% |
News
The latest news and videos published on DELTA DRONE at the time of the analysis were as follows:
- Delta Drone - Drawing of a tranche of ORNAN of €1 million in nominal value
- DELTA DRONE - Drawing of a tranche of ORNAN of €2.5 million in nominal value and significant reduction in potential dilution
- DELTA DRONE - Consolidation of Delta Drone shares to support a new stock market dynamic and reduce the volatility of the stock
- Suspension of the exercise of the BSAY in the context of the operations of consolidation of the shares of the company Delta Drone
- FY 2021: Delta Drone continues its development while having many high-value assets strengthening its financial situation
About author

Online


Add a comment
Comments
0 comments on the analysis TONNER DRONES - Daily