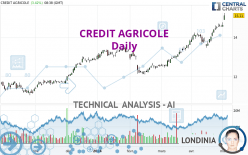
CREDIT AGRICOLE - Daily - Technical analysis published on 05/03/2024 (GMT)
- 70
- 0
Click here for a new analysis!
- Timeframe : Daily
- - Analysis generated on
- Status : TARGET REACHED

Summary of the analysis

Additional analysis
Quotes
The CREDIT AGRICOLE rating is 15.110 EUR. On the day, this instrument gained +3.42% and was between 14.885 EUR and 15.230 EUR. This implies that the price is at +1.51% from its lowest and at -0.79% from its highest.The Central Gaps scanner detects the formation of a bullish gap marking the strong presence of buyers against sellers at the opening. This formed a quotation gap.
Opening Gap UP
Type : Bullish
Timeframe : Openning
Here is a more detailed summary of the historical variations registered by CREDIT AGRICOLE:
New HIGH record (5 years)
Type : Bullish
Timeframe : Weekly
New HIGH record (1 year)
Type : Bullish
Timeframe : Weekly
New HIGH record (1st january)
Type : Bullish
Timeframe : Weekly
New HIGH record (1 month)
Type : Bullish
Timeframe : Weekly
Technical
Technical analysis of this Daily chart of CREDIT AGRICOLE indicates that the overall trend is strongly bullish. 92.86% of the signals given by moving averages are bullish. This strongly bullish trend is supported by the strong bullish signals given by short-term moving averages. An assessment of moving averages reveals a bearish signal that could impact this trend:
Moving Average bearish crossovers : AMA20 & AMA50
Type : Bearish
Timeframe : Daily
In fact, 16 technical indicators on 18 studied are currently positioned bullish. Caution: the Central Indicators scanner currently detects an excess:
RSI indicator is overbought : over 80
Type : Neutral
Timeframe : Daily
CCI indicator is overbought : over 100
Type : Neutral
Timeframe : Daily
Williams %R indicator is overbought : over -20
Type : Neutral
Timeframe : Daily
Pivot points : price is over resistance 1
Type : Neutral
Timeframe : Weekly
Pivot points : price is over resistance 3
Type : Neutral
Timeframe : Daily
The Central Patterns scanner, which studies chart patterns, resistances and supports, has identified this signal:
Resistance of channel is broken
Type : Bullish
Timeframe : Daily
For a small rebound in the very short term, the Central Candlesticks scanner currently notes the presence of this bullish pattern in Japanese candlesticks:
Upside gap
Type : Bullish
Timeframe : Daily
| S3 | S2 | S1 | Price | |
|---|---|---|---|---|
| ProTrendLines | 12.599 | 13.468 | 14.145 | 15.110 |
| Change (%) | -16.62% | -10.87% | -6.39% | - |
| Change | -2.511 | -1.642 | -0.965 | - |
| Level | Minor | Major | Minor | - |
Pivot points can also be used to set your price objectives. Here is the price situation in relation to pivot points:
| Pivot points | S3 | S2 | S1 | PP | R1 | R2 | R3 |
|---|---|---|---|---|---|---|---|
| Standard | 14.285 | 14.410 | 14.510 | 14.635 | 14.735 | 14.860 | 14.960 |
| Camarilla | 14.548 | 14.569 | 14.589 | 14.610 | 14.631 | 14.651 | 14.672 |
| Woodie | 14.273 | 14.404 | 14.498 | 14.629 | 14.723 | 14.854 | 14.948 |
| Fibonacci | 14.410 | 14.496 | 14.549 | 14.635 | 14.721 | 14.774 | 14.860 |
| Pivot points | S3 | S2 | S1 | PP | R1 | R2 | R3 |
|---|---|---|---|---|---|---|---|
| Standard | 13.520 | 13.785 | 14.170 | 14.435 | 14.820 | 15.085 | 15.470 |
| Camarilla | 14.376 | 14.436 | 14.495 | 14.555 | 14.615 | 14.674 | 14.734 |
| Woodie | 13.580 | 13.815 | 14.230 | 14.465 | 14.880 | 15.115 | 15.530 |
| Fibonacci | 13.785 | 14.033 | 14.187 | 14.435 | 14.683 | 14.837 | 15.085 |
| Pivot points | S3 | S2 | S1 | PP | R1 | R2 | R3 |
|---|---|---|---|---|---|---|---|
| Standard | 12.550 | 13.010 | 13.780 | 14.240 | 15.010 | 15.470 | 16.240 |
| Camarilla | 14.212 | 14.325 | 14.437 | 14.550 | 14.663 | 14.776 | 14.888 |
| Woodie | 12.705 | 13.088 | 13.935 | 14.318 | 15.165 | 15.548 | 16.395 |
| Fibonacci | 13.010 | 13.480 | 13.770 | 14.240 | 14.710 | 15.000 | 15.470 |
Numerical data
The following is the status of the technical indicators and moving averages at the time of publication of this technical analysis:
| RSI (14): | 83.49 | |
| MACD (12,26,9): | 0.3450 | |
| Directional Movement: | 34.905 | |
| AROON (14): | 85.714 | |
| DEMA (21): | 14.679 | |
| Parabolic SAR (0,02-0,02-0,2): | 13.969 | |
| Elder Ray (13): | 0.638 | |
| Super Trend (3,10): | 14.317 | |
| Zig ZAG (10): | 15.095 | |
| VORTEX (21): | 1.1270 | |
| Stochastique (14,3,5): | 88.84 | |
| TEMA (21): | 14.781 | |
| Williams %R (14): | -7.39 | |
| Chande Momentum Oscillator (20): | 1.525 | |
| Repulse (5,40,3): | 0.9050 | |
| ROCnROLL: | 1 | |
| TRIX (15,9): | 0.3110 | |
| Courbe Coppock: | 10.57 |
| MA7: | 14.612 | |
| MA20: | 14.188 | |
| MA50: | 13.502 | |
| MA100: | 13.210 | |
| MAexp7: | 14.620 | |
| MAexp20: | 14.238 | |
| MAexp50: | 13.716 | |
| MAexp100: | 13.209 | |
| Price / MA7: | +3.41% | |
| Price / MA20: | +6.50% | |
| Price / MA50: | +11.91% | |
| Price / MA100: | +14.38% | |
| Price / MAexp7: | +3.35% | |
| Price / MAexp20: | +6.12% | |
| Price / MAexp50: | +10.16% | |
| Price / MAexp100: | +14.39% |
News
The latest news and videos published on CREDIT AGRICOLE at the time of the analysis were as follows:
- CREDIT AGRICOLE SA: Q1-2024 Results : THE GROUP CONTINUES TO GROW
- Release of the 2023 Credit Agricole Assurances group’s SFCR
- CREDIT AGRICOLE SA: Availability of Crédit Agricole S.A.’s 2023 Universal Registration Document and Annual Financial Report
- Crédit Agricole S.A. announces the reduction of its share capital through the cancellation of treasury shares purchased under a share repurchase program
- CREDIT AGRICOLE SA: Fourth quarter and full-year 2023 - VERY GOOD RESULTS IN 2023
About author

Online


Add a comment
Comments
0 comments on the analysis CREDIT AGRICOLE - Daily