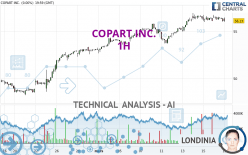
COPART INC. - 1H - Technical analysis published on 03/19/2024 (GMT)
- 101
- 0
Click here for a new analysis!
- Timeframe : 1H
- - Analysis generated on
- Status : TARGET REACHED

Summary of the analysis

Additional analysis
Quotes
The COPART INC. price is 56.09 USD. The price registered a decrease of -0.07% on the session and was between 56.04 USD and 56.77 USD. This implies that the price is at +0.09% from its lowest and at -1.20% from its highest.The Central Gaps scanner detects a bullish opening marking the presence of buyers ahead of sellers at the opening but not sufficiently marked to allow the price to register a quotation gap.
Bullish opening
Type : Bullish
Timeframe : Openning
A study of price movements over other periods shows the following variations:
Near a new HIGH record (5 years)
Type : Bullish
Timeframe : Weekly
Near a new HIGH record (1 year)
Type : Bullish
Timeframe : Weekly
Near a new HIGH record (1st january)
Type : Bullish
Timeframe : Weekly
Near a new HIGH record (1 month)
Type : Bullish
Timeframe : Weekly
Technical
Technical analysis of this 1H chart of COPART INC. indicates that the overall trend is bullish. The signals given by moving averages are 71.43% bullish. This bullish trend could slow down given the neutral signals currently being given by short-term moving averages. An assessment of moving averages reveals a bearish signal that could impact this trend:
Bearish price crossover with adaptative moving average 100
Type : Bearish
Timeframe : 1 hour
On the 18 technical indicators analysed, 4 are bullish, 8 are neutral and 6 are bearish. Caution: the Central Indicators scanner currently detects an excess:
CCI indicator is oversold : under -100
Type : Neutral
Timeframe : 1 hour
Williams %R indicator is oversold : under -80
Type : Neutral
Timeframe : 1 hour
RSI indicator is back under 50
Type : Bearish
Timeframe : 1 hour
Parabolic SAR indicator bearish reversal
Type : Bearish
Timeframe : 1 hour
Price is back under the pivot point
Type : Bearish
Timeframe : 1 hour
Momentum indicator is back under 0
Type : Bearish
Timeframe : 1 hour
Central Patterns, the market scanner focusing on chart patterns, resistances and supports found these results:
Near horizontal support
Type : Bullish
Timeframe : 1 hour
Support of channel is broken
Type : Bearish
Timeframe : 1 hour
The Central Candlesticks scanner, specialised in Japanese candlesticks, did not identify any signals.
| S3 | S2 | S1 | Price | R1 | |
|---|---|---|---|---|---|
| ProTrendLines | 51.20 | 53.70 | 56.00 | 56.09 | 56.96 |
| Change (%) | -8.72% | -4.26% | -0.16% | - | +1.55% |
| Change | -4.89 | -2.39 | -0.09 | - | +0.87 |
| Level | Intermediate | Intermediate | Intermediate | - | Intermediate |
Attention could also be paid to pivot points to set price objectives:
| Pivot points | S3 | S2 | S1 | PP | R1 | R2 | R3 |
|---|---|---|---|---|---|---|---|
| Standard | 55.09 | 55.54 | 55.84 | 56.29 | 56.59 | 57.04 | 57.34 |
| Camarilla | 55.92 | 55.99 | 56.06 | 56.13 | 56.20 | 56.27 | 56.34 |
| Woodie | 55.01 | 55.50 | 55.76 | 56.25 | 56.51 | 57.00 | 57.26 |
| Fibonacci | 55.54 | 55.83 | 56.01 | 56.29 | 56.58 | 56.76 | 57.04 |
| Pivot points | S3 | S2 | S1 | PP | R1 | R2 | R3 |
|---|---|---|---|---|---|---|---|
| Standard | 50.99 | 52.35 | 54.24 | 55.60 | 57.49 | 58.85 | 60.74 |
| Camarilla | 55.24 | 55.53 | 55.83 | 56.13 | 56.43 | 56.73 | 57.02 |
| Woodie | 51.26 | 52.48 | 54.51 | 55.73 | 57.76 | 58.98 | 61.01 |
| Fibonacci | 52.35 | 53.59 | 54.36 | 55.60 | 56.84 | 57.61 | 58.85 |
| Pivot points | S3 | S2 | S1 | PP | R1 | R2 | R3 |
|---|---|---|---|---|---|---|---|
| Standard | 44.36 | 46.21 | 49.68 | 51.53 | 55.00 | 56.85 | 60.32 |
| Camarilla | 51.69 | 52.18 | 52.66 | 53.15 | 53.64 | 54.13 | 54.61 |
| Woodie | 45.17 | 46.62 | 50.49 | 51.94 | 55.81 | 57.26 | 61.13 |
| Fibonacci | 46.21 | 48.24 | 49.50 | 51.53 | 53.56 | 54.82 | 56.85 |
Numerical data
The following is the status of the technical indicators and moving averages at the time of publication of this technical analysis:
| RSI (14): | 48.74 | |
| MACD (12,26,9): | 0.1700 | |
| Directional Movement: | -2.30 | |
| AROON (14): | 42.85 | |
| DEMA (21): | 56.54 | |
| Parabolic SAR (0,02-0,02-0,2): | 56.77 | |
| Elder Ray (13): | -0.09 | |
| Super Trend (3,10): | 55.64 | |
| Zig ZAG (10): | 56.09 | |
| VORTEX (21): | 0.9500 | |
| Stochastique (14,3,5): | 38.96 | |
| TEMA (21): | 56.40 | |
| Williams %R (14): | -88.31 | |
| Chande Momentum Oscillator (20): | -0.20 | |
| Repulse (5,40,3): | -0.8200 | |
| ROCnROLL: | -1 | |
| TRIX (15,9): | 0.0700 | |
| Courbe Coppock: | 0.47 |
| MA7: | 55.65 | |
| MA20: | 53.54 | |
| MA50: | 50.76 | |
| MA100: | 49.37 | |
| MAexp7: | 56.32 | |
| MAexp20: | 56.25 | |
| MAexp50: | 55.69 | |
| MAexp100: | 54.63 | |
| Price / MA7: | +0.79% | |
| Price / MA20: | +4.76% | |
| Price / MA50: | +10.50% | |
| Price / MA100: | +13.61% | |
| Price / MAexp7: | -0.41% | |
| Price / MAexp20: | -0.28% | |
| Price / MAexp50: | +0.72% | |
| Price / MAexp100: | +2.67% |
News
The latest news and videos published on COPART INC. at the time of the analysis were as follows:
- Copart Appoints Jeff Liaw as CEO and Director and Jay Adair as Executive Chairman
- Copart, Inc. Announces Senior Leadership Appointments
- Copart Announces Investment in Heavy Equipment Auction Company Purple Wave
- Hi Marley and Copart Announce Strategic Partnership to Support Auto Insurers
- Copart, Inc. Announces a Two-for-One Stock Split
About author
Online


Add a comment
Comments
0 comments on the analysis COPART INC. - 1H