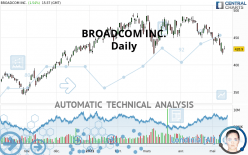
BROADCOM INC. - Daily - Technical analysis published on 05/13/2021 (GMT)
- 305
- 0
Click here for a new analysis!
- Timeframe : Daily
- - Analysis generated on
- Status : INVALID

Summary of the analysis

Additional analysis
Quotes
BROADCOM INC. rating 428.90 USD. On the day, this instrument gained +1.54% and was between 428.00 USD and 434.82 USD. This implies that the price is at +0.21% from its lowest and at -1.36% from its highest.The Central Gaps scanner detects a bullish opening. A small advantage for buyers in the very short term.
Bullish opening
Type : Bullish
Timeframe : Openning
So that you have an overall view of the price change, here is a table showing the variations over several periods:
Near a new LOW record (1st january)
Type : Bearish
Timeframe : Weekly
Near a new LOW record (1 month)
Type : Bearish
Timeframe : Weekly
Technical
Technical analysis of this Daily chart of BROADCOM INC. indicates that the overall trend is bearish. The signals given by moving averages are 71.43% bearish. This bearish trend is reinforced by the strong signals currently being given by short-term moving averages. There is no crossing of moving average by the price or crossing of moving averages between themselves.
In fact, Central Analyzer took into account 18 technical indicators and the result was as follows: 4 are bullish, 2 are neutral and 12 are bearish. Caution: the Central Indicators scanner currently detects an excess:
CCI indicator is oversold : under -100
Type : Neutral
Timeframe : Daily
Williams %R indicator is oversold : under -80
Type : Neutral
Timeframe : Daily
Pivot points : price is over resistance 1
Type : Neutral
Timeframe : Daily
Pivot points : price is under support 1
Type : Neutral
Timeframe : Weekly
Price is back under the pivot point
Type : Bearish
Timeframe : Daily
An analysis of the price chart with the Central Patterns scanner (detector of chart patterns and resistances and supports) shows several results that can have an impact on the price change:
Horizontal resistance is broken
Type : Bullish
Timeframe : Daily
Support of channel is broken
Type : Bearish
Timeframe : Daily
Support of triangle is broken
Type : Bearish
Timeframe : Daily
No result was found by the Central Candlesticks scanner on Japanese candlesticks.
| S3 | S2 | S1 | Price | R1 | R2 | |
|---|---|---|---|---|---|---|
| ProTrendLines | 381.91 | 405.82 | 421.25 | 428.90 | 455.46 | 489.66 |
| Change (%) | -10.96% | -5.38% | -1.78% | - | +6.19% | +14.17% |
| Change | -46.99 | -23.08 | -7.65 | - | +26.56 | +60.76 |
| Level | Major | Minor | Intermediate | - | Intermediate | Major |
Pivot points can also be used to set your price objectives. Here is the price situation in relation to pivot points:
| Pivot points | S3 | S2 | S1 | PP | R1 | R2 | R3 |
|---|---|---|---|---|---|---|---|
| Standard | 405.67 | 412.41 | 417.39 | 424.13 | 429.11 | 435.85 | 440.83 |
| Camarilla | 419.16 | 420.23 | 421.31 | 422.38 | 423.45 | 424.53 | 425.60 |
| Woodie | 404.80 | 411.97 | 416.52 | 423.69 | 428.24 | 435.41 | 439.96 |
| Fibonacci | 412.41 | 416.88 | 419.65 | 424.13 | 428.60 | 431.37 | 435.85 |
| Pivot points | S3 | S2 | S1 | PP | R1 | R2 | R3 |
|---|---|---|---|---|---|---|---|
| Standard | 417.45 | 427.38 | 439.98 | 449.91 | 462.51 | 472.44 | 485.04 |
| Camarilla | 446.38 | 448.45 | 450.52 | 452.58 | 454.65 | 456.71 | 458.78 |
| Woodie | 418.79 | 428.05 | 441.32 | 450.58 | 463.85 | 473.11 | 486.38 |
| Fibonacci | 427.38 | 435.99 | 441.30 | 449.91 | 458.52 | 463.83 | 472.44 |
| Pivot points | S3 | S2 | S1 | PP | R1 | R2 | R3 |
|---|---|---|---|---|---|---|---|
| Standard | 399.61 | 424.31 | 440.25 | 464.95 | 480.89 | 505.59 | 521.53 |
| Camarilla | 445.02 | 448.75 | 452.48 | 456.20 | 459.93 | 463.65 | 467.38 |
| Woodie | 395.24 | 422.12 | 435.88 | 462.76 | 476.52 | 503.40 | 517.16 |
| Fibonacci | 424.31 | 439.83 | 449.42 | 464.95 | 480.47 | 490.06 | 505.59 |
Numerical data
The following is the status of technical indicators and moving averages registered at the time this technical analysis was created:
| RSI (14): | 38.22 | |
| MACD (12,26,9): | -9.8200 | |
| Directional Movement: | -17.07 | |
| AROON (14): | -78.57 | |
| DEMA (21): | 439.35 | |
| Parabolic SAR (0,02-0,02-0,2): | 454.70 | |
| Elder Ray (13): | -13.12 | |
| Super Trend (3,10): | 464.06 | |
| Zig ZAG (10): | 430.84 | |
| VORTEX (21): | 0.6800 | |
| Stochastique (14,3,5): | 19.95 | |
| TEMA (21): | 431.45 | |
| Williams %R (14): | -80.30 | |
| Chande Momentum Oscillator (20): | -36.23 | |
| Repulse (5,40,3): | -1.1100 | |
| ROCnROLL: | 2 | |
| TRIX (15,9): | -0.2100 | |
| Courbe Coppock: | 11.49 |
| MA7: | 438.88 | |
| MA20: | 453.51 | |
| MA50: | 462.04 | |
| MA100: | 459.91 | |
| MAexp7: | 437.23 | |
| MAexp20: | 450.71 | |
| MAexp50: | 458.05 | |
| MAexp100: | 448.48 | |
| Price / MA7: | -2.27% | |
| Price / MA20: | -5.43% | |
| Price / MA50: | -7.17% | |
| Price / MA100: | -6.74% | |
| Price / MAexp7: | -1.91% | |
| Price / MAexp20: | -4.84% | |
| Price / MAexp50: | -6.36% | |
| Price / MAexp100: | -4.37% |
News
The latest news and videos published on BROADCOM INC. at the time of the analysis were as follows:
- Broadcom Inc. Announces Pricing and Upsizing of Mandatory Convertible Preferred Stock Offering
- Broadcom Inc. Announces Offering of Mandatory Convertible Preferred Stock
-
 Jim Cramer Breaks Down Broadcom, U.S.-China Trade War, Markets
- Broadcom Inc. Announces Third Quarter Fiscal Year 2019 Financial Results and Quarterly Dividend
- Broadcom Unveils Portfolio for RDK Video Accelerator Program
About author

Online


Add a comment
Comments
0 comments on the analysis BROADCOM INC. - Daily