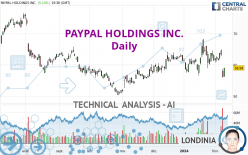
PAYPAL HOLDINGS INC. - Daily - Technical analysis published on 02/09/2024 (GMT)
- 164
- 0
Click here for a new analysis!
- Timeframe : Daily
- - Analysis generated on
- Status : LEVEL MAINTAINED

Summary of the analysis

Additional analysis
Quotes
The PAYPAL HOLDINGS INC. price is 58.99 USD. The price registered an increase of +5.10% on the session with the lowest point at 56.16 USD and the highest point at 58.99 USD. The deviation from the price is +5.04% for the low point and 0% for the high point.The Central Gaps scanner detects a bullish opening marking the presence of buyers ahead of sellers at the opening but not sufficiently marked to allow the price to register a quotation gap.
Bullish opening
Type : Bullish
Timeframe : Openning
So that you have an overall view of the price change, here is a table showing the variations over several periods:
Near a new LOW record (1st january)
Type : Bearish
Timeframe : Weekly
Near a new LOW record (1 month)
Type : Bearish
Timeframe : Weekly
Technical
A technical analysis in Daily of this PAYPAL HOLDINGS INC. chart shows a slightly bearish trend. 60.71% of the signals given by moving averages are bearish. The overall trend could accelerate as a result of the strong bearish signals from short-term moving averages. An assessment of moving averages reveals several bearish and bullish signals:
Bearish trend reversal : Moving Average 20
Type : Bearish
Timeframe : Daily
Bearish trend reversal : adaptative moving average 20
Type : Bearish
Timeframe : Daily
Bearish trend reversal : adaptative moving average 50
Type : Bearish
Timeframe : Daily
Bearish trend reversal : adaptative moving average 100
Type : Bearish
Timeframe : Daily
Bullish price crossover with Moving Average 100
Type : Bullish
Timeframe : Daily
An assessment of technical indicators does not currently provide any relevant information to suggest whether the signal given by the technical indicators is more bullish or bearish.
Caution: the Central Indicators scanner currently detects an excess:
CCI indicator is oversold : under -100
Type : Neutral
Timeframe : Daily
Previous candle closed under Bollinger bands
Type : Neutral
Timeframe : Daily
Pivot points : price is over resistance 1
Type : Neutral
Timeframe : Daily
Pivot points : price is under support 3
Type : Neutral
Timeframe : Weekly
The Central Patterns scanner, which studies chart patterns, resistances and supports, has identified these signals:
Near horizontal support
Type : Bullish
Timeframe : Daily
Near support of triangle
Type : Bullish
Timeframe : Daily
Support of channel is broken
Type : Bearish
Timeframe : Daily
For a small setback in the very short term, the Central Candlesticks scanner currently notes the presence of this bearish pattern in Japanese candlesticks:
Downside Tasuki gap
Type : Bearish
Timeframe : Daily
| S3 | S2 | S1 | Price | R1 | R2 | R3 | |
|---|---|---|---|---|---|---|---|
| ProTrendLines | 50.39 | 55.98 | 58.51 | 58.99 | 63.08 | 65.86 | 68.89 |
| Change (%) | -14.58% | -5.10% | -0.81% | - | +6.93% | +11.65% | +16.78% |
| Change | -8.60 | -3.01 | -0.48 | - | +4.09 | +6.87 | +9.90 |
| Level | Minor | Minor | Major | - | Minor | Major | Intermediate |
Pivot points can also be used to set your price objectives. Here is the price situation in relation to pivot points:
| Pivot points | S3 | S2 | S1 | PP | R1 | R2 | R3 |
|---|---|---|---|---|---|---|---|
| Standard | 52.25 | 54.01 | 55.07 | 56.83 | 57.89 | 59.65 | 60.71 |
| Camarilla | 55.36 | 55.61 | 55.87 | 56.13 | 56.39 | 56.65 | 56.91 |
| Woodie | 51.90 | 53.84 | 54.72 | 56.66 | 57.54 | 59.48 | 60.36 |
| Fibonacci | 54.01 | 55.09 | 55.75 | 56.83 | 57.91 | 58.57 | 59.65 |
| Pivot points | S3 | S2 | S1 | PP | R1 | R2 | R3 |
|---|---|---|---|---|---|---|---|
| Standard | 56.68 | 58.66 | 60.54 | 62.52 | 64.40 | 66.38 | 68.26 |
| Camarilla | 61.36 | 61.71 | 62.07 | 62.42 | 62.77 | 63.13 | 63.48 |
| Woodie | 56.63 | 58.64 | 60.49 | 62.50 | 64.35 | 66.36 | 68.21 |
| Fibonacci | 58.66 | 60.14 | 61.05 | 62.52 | 64.00 | 64.91 | 66.38 |
| Pivot points | S3 | S2 | S1 | PP | R1 | R2 | R3 |
|---|---|---|---|---|---|---|---|
| Standard | 44.07 | 50.27 | 55.81 | 62.01 | 67.55 | 73.75 | 79.29 |
| Camarilla | 58.12 | 59.20 | 60.27 | 61.35 | 62.43 | 63.50 | 64.58 |
| Woodie | 43.74 | 50.11 | 55.48 | 61.85 | 67.22 | 73.59 | 78.96 |
| Fibonacci | 50.27 | 54.76 | 57.53 | 62.01 | 66.50 | 69.27 | 73.75 |
Numerical data
The following is the status of the technical indicators and moving averages at the time of publication of this technical analysis:
| RSI (14): | 44.17 | |
| MACD (12,26,9): | -0.2300 | |
| Directional Movement: | -9.65 | |
| AROON (14): | -92.86 | |
| DEMA (21): | 61.39 | |
| Parabolic SAR (0,02-0,02-0,2): | 67.96 | |
| Elder Ray (13): | -3.73 | |
| Super Trend (3,10): | 65.66 | |
| Zig ZAG (10): | 58.83 | |
| VORTEX (21): | 0.9700 | |
| Stochastique (14,3,5): | 26.64 | |
| TEMA (21): | 60.58 | |
| Williams %R (14): | -69.84 | |
| Chande Momentum Oscillator (20): | -4.15 | |
| Repulse (5,40,3): | 3.1300 | |
| ROCnROLL: | 2 | |
| TRIX (15,9): | 0.0800 | |
| Courbe Coppock: | 4.17 |
| MA7: | 61.14 | |
| MA20: | 61.89 | |
| MA50: | 61.08 | |
| MA100: | 58.62 | |
| MAexp7: | 60.54 | |
| MAexp20: | 61.40 | |
| MAexp50: | 60.81 | |
| MAexp100: | 60.81 | |
| Price / MA7: | -3.52% | |
| Price / MA20: | -4.69% | |
| Price / MA50: | -3.42% | |
| Price / MA100: | +0.63% | |
| Price / MAexp7: | -2.56% | |
| Price / MAexp20: | -3.93% | |
| Price / MAexp50: | -2.99% | |
| Price / MAexp100: | -2.99% |
News
Don't forget to follow the news on PAYPAL HOLDINGS INC.. At the time of publication of this analysis, the latest news was as follows:
-
 PayPal slides on disappointing profit growth outlook
- PayPal Reports Fourth Quarter and Full Year 2023 Results
- PayPal and Venmo Unveil Six New Innovations to Revolutionize Commerce
- Thinking about buying stock in Sagimet Biosciences, PayPal, Luxurban Hotels, Mega Matrix, or Archer Aviation?
- Tune in to an Exclusive Preview of the Newest Innovations from PayPal and Venmo
About author

Online


Add a comment
Comments
0 comments on the analysis PAYPAL HOLDINGS INC. - Daily