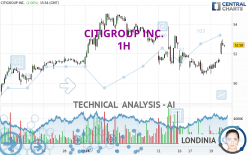
CITIGROUP INC. - 1H - Technical analysis published on 01/22/2024 (GMT)
- 135
- 0
Click here for a new analysis!
- Timeframe : 1H
- - Analysis generated on
- Status : TARGET REACHED

Summary of the analysis

Additional analysis
Quotes
The CITIGROUP INC. price is 52.62 USD. The price has increased by +2.14% since the last closing and was between 51.95 USD and 52.95 USD. This implies that the price is at +1.29% from its lowest and at -0.62% from its highest.A bullish gap was detected at the opening by the Central Gaps scanner. There are a lot of buyers and they have the upper hand in the very short term.
Opening Gap UP
Type : Bullish
Timeframe : Openning
Here is a more detailed summary of the historical variations registered by CITIGROUP INC.:
Near a new HIGH record (1 year)
Type : Bullish
Timeframe : Weekly
Near a new HIGH record (1st january)
Type : Bullish
Timeframe : Weekly
Near a new HIGH record (1 month)
Type : Bullish
Timeframe : Weekly
Technical
Technical analysis of this 1H chart of CITIGROUP INC. indicates that the overall trend is bullish. 64.29% of the signals given by moving averages are bullish. The overall trend is reinforced by the strong bullish signals from short-term moving averages. The Central Indicators scanner detects bullish signals on moving averages that could impact this trend:
Bullish trend reversal : Moving Average 100
Type : Bullish
Timeframe : 1 hour
Bullish trend reversal : adaptative moving average 50
Type : Bullish
Timeframe : 1 hour
Bullish trend reversal : adaptative moving average 100
Type : Bullish
Timeframe : 1 hour
Bullish price crossover with adaptative moving average 100
Type : Bullish
Timeframe : 1 hour
The probability of a further increase is high given the direction of the technical indicators.
But beware of excesses. The Central Indicators scanner currently detects this:
CCI indicator is overbought : over 100
Type : Neutral
Timeframe : 1 hour
Previous candle closed over Bollinger bands
Type : Neutral
Timeframe : 1 hour
Williams %R indicator is overbought : over -20
Type : Neutral
Timeframe : 1 hour
Pivot points : price is over resistance 1
Type : Neutral
Timeframe : Weekly
Pivot points : price is over resistance 2
Type : Neutral
Timeframe : 1 hour
The Central Patterns scanner, which studies chart patterns, resistances and supports, has identified this signal:
Resistance of channel is broken
Type : Bullish
Timeframe : 1 hour
The Central Candlesticks scanner, specialised in Japanese candlesticks, did not identify any signals.
| S3 | S2 | S1 | Price | R1 | R2 | R3 | |
|---|---|---|---|---|---|---|---|
| ProTrendLines | 49.18 | 50.52 | 51.10 | 52.62 | 53.02 | 54.06 | 54.74 |
| Change (%) | -6.54% | -3.99% | -2.89% | - | +0.76% | +2.74% | +4.03% |
| Change | -3.44 | -2.10 | -1.52 | - | +0.40 | +1.44 | +2.12 |
| Level | Intermediate | Intermediate | Major | - | Minor | Major | Intermediate |
Attention could also be paid to pivot points to set price objectives:
| Pivot points | S3 | S2 | S1 | PP | R1 | R2 | R3 |
|---|---|---|---|---|---|---|---|
| Standard | 49.81 | 50.21 | 50.87 | 51.27 | 51.93 | 52.33 | 52.99 |
| Camarilla | 51.23 | 51.33 | 51.42 | 51.52 | 51.62 | 51.71 | 51.81 |
| Woodie | 49.93 | 50.28 | 50.99 | 51.34 | 52.05 | 52.40 | 53.11 |
| Fibonacci | 50.21 | 50.62 | 50.87 | 51.27 | 51.68 | 51.93 | 52.33 |
| Pivot points | S3 | S2 | S1 | PP | R1 | R2 | R3 |
|---|---|---|---|---|---|---|---|
| Standard | 48.90 | 49.71 | 50.61 | 51.42 | 52.32 | 53.13 | 54.03 |
| Camarilla | 51.05 | 51.21 | 51.36 | 51.52 | 51.68 | 51.83 | 51.99 |
| Woodie | 48.96 | 49.73 | 50.67 | 51.44 | 52.38 | 53.15 | 54.09 |
| Fibonacci | 49.71 | 50.36 | 50.76 | 51.42 | 52.07 | 52.47 | 53.13 |
| Pivot points | S3 | S2 | S1 | PP | R1 | R2 | R3 |
|---|---|---|---|---|---|---|---|
| Standard | 41.72 | 43.81 | 47.62 | 49.71 | 53.52 | 55.61 | 59.42 |
| Camarilla | 49.82 | 50.36 | 50.90 | 51.44 | 51.98 | 52.52 | 53.06 |
| Woodie | 42.59 | 44.24 | 48.49 | 50.14 | 54.39 | 56.04 | 60.29 |
| Fibonacci | 43.81 | 46.06 | 47.45 | 49.71 | 51.96 | 53.35 | 55.61 |
Numerical data
The following are the details of the technical indicators and moving averages that were collected to generate this technical analysis:
| RSI (14): | 66.70 | |
| MACD (12,26,9): | 0.1000 | |
| Directional Movement: | 17.33 | |
| AROON (14): | 92.86 | |
| DEMA (21): | 51.57 | |
| Parabolic SAR (0,02-0,02-0,2): | 51.12 | |
| Elder Ray (13): | 1.10 | |
| Super Trend (3,10): | 51.41 | |
| Zig ZAG (10): | 52.66 | |
| VORTEX (21): | 1.0900 | |
| Stochastique (14,3,5): | 89.84 | |
| TEMA (21): | 51.93 | |
| Williams %R (14): | -11.07 | |
| Chande Momentum Oscillator (20): | 1.95 | |
| Repulse (5,40,3): | 1.0700 | |
| ROCnROLL: | 1 | |
| TRIX (15,9): | -0.0400 | |
| Courbe Coppock: | 3.23 |
| MA7: | 51.88 | |
| MA20: | 52.29 | |
| MA50: | 48.77 | |
| MA100: | 44.58 | |
| MAexp7: | 51.92 | |
| MAexp20: | 51.57 | |
| MAexp50: | 51.82 | |
| MAexp100: | 51.86 | |
| Price / MA7: | +1.43% | |
| Price / MA20: | +0.63% | |
| Price / MA50: | +7.89% | |
| Price / MA100: | +18.03% | |
| Price / MAexp7: | +1.35% | |
| Price / MAexp20: | +2.04% | |
| Price / MAexp50: | +1.54% | |
| Price / MAexp100: | +1.47% |
News
The last news published on CITIGROUP INC. at the time of the generation of this analysis was as follows:
- Investor Network: Citigroup Inc to Host Earnings Call
- Communications Sales & Leasing to Present at the Citi 2017 Internet, Media & Telecommunications Conference
- Amgen To Present At The Citi 2016 Global Healthcare Conference
- VolitionRx Limited to Attend Citi 2016 Global Healthcare Conference
- Allergan to Present at 2016 Citi Global Healthcare Conference
About author
Online


Add a comment
Comments
0 comments on the analysis CITIGROUP INC. - 1H