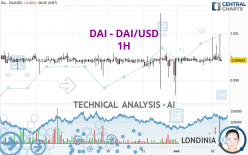
DAI - DAI/USD - 1H - Technical analysis published on 04/02/2024 (GMT)
- 85
- 0
- Timeframe : 1H
- - Analysis generated on
- Status : NEUTRAL

Summary of the analysis

Additional analysis
Quotes
The DAI - DAI/USD price is 0.999851 USD. On the day, this instrument gained +0.00% and was between 0.999803 USD and 1.000858 USD. This implies that the price is at +0.00% from its lowest and at -0.10% from its highest.Here is a more detailed summary of the historical variations registered by DAI - DAI/USD:
Near a new HIGH record (1 year)
Type : Bullish
Timeframe : Weekly
Near a new HIGH record (1st january)
Type : Bullish
Timeframe : Weekly
Near a new HIGH record (1 month)
Type : Bullish
Timeframe : Weekly
Abnormal volumes on DAI - DAI/USD were detected by the Central Volumes scanner:
Abnormal volumes
Timeframe : 50 days
Technical
Technical analysis of DAI - DAI/USD in 1H shows a neutral overall trend. This generally neutral trend is confirmed by the neutral signals currently given by short-term moving averages. The Central Indicators scanner detects bullish and bearish signals on moving averages that could impact this trend:
Bearish trend reversal : Moving Average 20
Type : Bearish
Timeframe : 1 hour
Bearish trend reversal : adaptative moving average 50
Type : Bearish
Timeframe : 1 hour
Bearish trend reversal : adaptative moving average 100
Type : Bearish
Timeframe : 1 hour
Bullish price crossover with Moving Average 50
Type : Bullish
Timeframe : 1 hour
Bullish price crossover with Moving Average 100
Type : Bullish
Timeframe : 1 hour
Bullish price crossover with adaptative moving average 50
Type : Bullish
Timeframe : 1 hour
Bullish price crossover with adaptative moving average 100
Type : Bullish
Timeframe : 1 hour
The technical indicators are generally neutral. They do not provide relevant information on the direction of future price movements.
But beware of excesses. The Central Indicators scanner currently detects this:
Williams %R indicator is oversold : under -80
Type : Neutral
Timeframe : 1 hour
RSI indicator is back over 50
Type : Bullish
Timeframe : 1 hour
MACD crosses DOWN its Moving Average
Type : Bearish
Timeframe : 1 hour
Price is back under the pivot point
Type : Bearish
Timeframe : 1 hour
Momentum indicator is back over 0
Type : Bullish
Timeframe : 1 hour
The Central Patterns scanner, which studies chart patterns, resistances and supports, has identified these signals:
Near horizontal support
Type : Bullish
Timeframe : 1 hour
Support of channel is broken
Type : Bearish
Timeframe : 1 hour
The Central Candlesticks scanner which studies Japanese candlesticks did not detect anything.
| S3 | S2 | S1 | Price | R1 | R2 | R3 | |
|---|---|---|---|---|---|---|---|
| ProTrendLines | 0.998972 | 0.999277 | 0.999664 | 0.999851 | 0.999993 | 1.001108 | 1.001864 |
| Change (%) | -0.09% | -0.06% | -0.02% | - | +0.01% | +0.13% | +0.20% |
| Change | -0.000879 | -0.000574 | -0.000187 | - | +0.000142 | +0.001257 | +0.002013 |
| Level | Minor | Minor | Major | - | Major | Intermediate | Minor |
Attention could also be paid to pivot points to set price objectives:
| Pivot points | S3 | S2 | S1 | PP | R1 | R2 | R3 |
|---|---|---|---|---|---|---|---|
| Standard | 0.999279 | 0.999459 | 0.999656 | 0.999836 | 1.000033 | 1.000213 | 1.000410 |
| Camarilla | 0.999749 | 0.999784 | 0.999818 | 0.999853 | 0.999888 | 0.999922 | 0.999957 |
| Woodie | 0.999288 | 0.999463 | 0.999665 | 0.999840 | 1.000042 | 1.000217 | 1.000419 |
| Fibonacci | 0.999459 | 0.999603 | 0.999692 | 0.999836 | 0.999980 | 1.000069 | 1.000213 |
| Pivot points | S3 | S2 | S1 | PP | R1 | R2 | R3 |
|---|---|---|---|---|---|---|---|
| Standard | 0.997767 | 0.998369 | 0.999115 | 0.999717 | 1.000463 | 1.001065 | 1.001811 |
| Camarilla | 0.999489 | 0.999613 | 0.999736 | 0.999860 | 0.999984 | 1.000107 | 1.000231 |
| Woodie | 0.997838 | 0.998405 | 0.999186 | 0.999753 | 1.000534 | 1.001101 | 1.001882 |
| Fibonacci | 0.998369 | 0.998884 | 0.999202 | 0.999717 | 1.000232 | 1.000550 | 1.001065 |
| Pivot points | S3 | S2 | S1 | PP | R1 | R2 | R3 |
|---|---|---|---|---|---|---|---|
| Standard | 0.986079 | 0.991940 | 0.995934 | 1.001795 | 1.005789 | 1.011650 | 1.015644 |
| Camarilla | 0.997218 | 0.998121 | 0.999025 | 0.999928 | 1.000831 | 1.001735 | 1.002638 |
| Woodie | 0.985146 | 0.991473 | 0.995001 | 1.001328 | 1.004856 | 1.011183 | 1.014711 |
| Fibonacci | 0.991940 | 0.995705 | 0.998030 | 1.001795 | 1.005560 | 1.007885 | 1.011650 |
Numerical data
The following is the status of technical indicators and moving averages registered at the time this technical analysis was created:
| RSI (14): | 48.91 | |
| MACD (12,26,9): | 0.0000 | |
| Directional Movement: | 33.393999 | |
| AROON (14): | 50.000000 | |
| DEMA (21): | 0.999908 | |
| Parabolic SAR (0,02-0,02-0,2): | 0.999336 | |
| Elder Ray (13): | -0.000038 | |
| Super Trend (3,10): | 1.000048 | |
| Zig ZAG (10): | 0.999906 | |
| VORTEX (21): | 0.9983 | |
| Stochastique (14,3,5): | 19.41 | |
| TEMA (21): | 0.999902 | |
| Williams %R (14): | -83.35 | |
| Chande Momentum Oscillator (20): | -0.000017 | |
| Repulse (5,40,3): | -0.0677 | |
| ROCnROLL: | 2 | |
| TRIX (15,9): | 0.0003 | |
| Courbe Coppock: | 0.01 |
| MA7: | 0.999866 | |
| MA20: | 0.999962 | |
| MA50: | 0.999830 | |
| MA100: | 0.999667 | |
| MAexp7: | 0.999885 | |
| MAexp20: | 0.999872 | |
| MAexp50: | 0.999851 | |
| MAexp100: | 0.999850 | |
| Price / MA7: | +0.00% | |
| Price / MA20: | -0.01% | |
| Price / MA50: | +0.00% | |
| Price / MA100: | +0.02% | |
| Price / MAexp7: | +0.00% | |
| Price / MAexp20: | +0.00% | |
| Price / MAexp50: | -0% | |
| Price / MAexp100: | +0.00% |
About author
Online


Add a comment
Comments
0 comments on the analysis DAI - DAI/USD - 1H