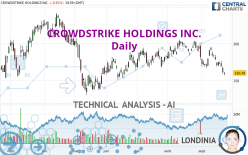
CROWDSTRIKE HOLDINGS INC. - Daily - Technical analysis published on 09/25/2022 (GMT)
- 216
- 0
Oops, I was wrong about that analysis. My threshold for invalidation has been broken.
Click here for a new analysis!
Click here for a new analysis!
- Timeframe : Daily
- - Analysis generated on
- Status : INVALID

Summary of the analysis
Trends
Short term:
Strongly bearish
Underlying:
Strongly bearish
Technical indicators
6%
72%
22%
My opinion
Bearish under 173.85 USD
My targets
156.72 USD (-2.29%)
137.40 USD (-14.33%)
My analysis
CROWDSTRIKE HOLDINGS INC. is part of a very strong bearish trend. Traders may consider trading only short positions (for sale) as long as the price remains well below 173.85 USD. The next support located at 156.72 USD is the next bearish objective to target. A bearish break of this support would revive the bearish momentum. The bearish movement could then continue towards the next support located at 137.40 USD. Below this support, sellers could then target 98.77 USD. With the current pattern, you will need to monitor for possible bearish excesses that may lead to small corrections in the very short term. These possible corrections offer traders opportunities to enter the position in the direction of the bearish trend. Trying to profit from the purchase of these possible corrections may seem risky.
In the very short term, the general bearish sentiment is confirmed by technical indicators. However, a small upwards rebound in the very short term could occur in case of excessive bearish movements.
Force
0
10
7.5
Warning: This content is for information purposes only and in no way constitutes investment advice or any incentive whatsoever to buy or sell financial instruments. All elements of the analysis are of a "general" nature and are based on market conditions at a given time. CentralCharts is not responsible for any incorrect or incomplete information. Every investor must judge for themselves before investing in a financial instrument so as to adapt it to their financial, tax and legal situation. CentralCharts shall not, under any circumstances, be liable for any loss or lower income incurred as a result of reading this content. Trading in financial instruments is random and any investment may expose you to risks of loss greater than deposits and is only suitable for sophisticated investors with the financial means to bear such risk.

This analysis was given by Clay707. Take part yourself by sharing additional analysis on another time unit:
Additional analysis
Quotes
The CROWDSTRIKE HOLDINGS INC. price is 160.39 USD. The price registered a decrease of -0.55% on the session and was between 157.06 USD and 161.65 USD. This implies that the price is at +2.12% from its lowest and at -0.78% from its highest.157.06
161.65
160.39
The Central Gaps scanner detects the formation of a bearish gap marking the strong presence of sellers ahead of buyers at the opening. This formed a quotation gap.
Opening Gap DOWN
Type : Bearish
Timeframe : Openning
So that you have an overall view of the price change, here is a table showing the variations over several periods:
New LOW record (1 month)
Type : Bearish
Timeframe : Weekly
Technical
A technical analysis in Daily of this CROWDSTRIKE HOLDINGS INC. chart shows a sharp bearish trend. The signals given by moving averages are 85.71% bearish. This strong bearish trend is confirmed by the strong signals currently being given by short-term moving averages. The Central Indicators market scanner currently does not detect any result that concerns moving averages.
In fact, 13 technical indicators on 18 studied are currently bearish. Caution: the Central Indicators scanner currently detects an excess:
CCI indicator is oversold : under -100
Type : Neutral
Timeframe : Daily
Williams %R indicator is oversold : under -80
Type : Neutral
Timeframe : Daily
Pivot points : price is under support 1
Type : Neutral
Timeframe : Weekly
The Central Patterns scanner, which studies chart patterns, resistances and supports, has identified these signals:
Near horizontal support
Type : Bullish
Timeframe : Daily
Support of channel is broken
Type : Bearish
Timeframe : Daily
The Central Candlesticks scanner, specialised in Japanese candlesticks, did not identify any signals.
ProTrendLines
S3
S2
S1
R1
R2
R3
Price
| S3 | S2 | S1 | Price | R1 | R2 | R3 | |
|---|---|---|---|---|---|---|---|
| ProTrendLines | 98.77 | 137.40 | 156.72 | 160.39 | 173.85 | 202.24 | 229.03 |
| Change (%) | -38.42% | -14.33% | -2.29% | - | +8.39% | +26.09% | +42.80% |
| Change | -61.62 | -22.99 | -3.67 | - | +13.46 | +41.85 | +68.64 |
| Level | Intermediate | Major | Major | - | Major | Major | Minor |
Attention could also be paid to pivot points to set price objectives:
Daily
| Pivot points | S3 | S2 | S1 | PP | R1 | R2 | R3 |
|---|---|---|---|---|---|---|---|
| Standard | 153.16 | 155.11 | 157.75 | 159.70 | 162.34 | 164.29 | 166.93 |
| Camarilla | 159.13 | 159.55 | 159.97 | 160.39 | 160.81 | 161.23 | 161.65 |
| Woodie | 153.51 | 155.28 | 158.10 | 159.87 | 162.69 | 164.46 | 167.28 |
| Fibonacci | 155.11 | 156.86 | 157.95 | 159.70 | 161.45 | 162.54 | 164.29 |
Weekly
| Pivot points | S3 | S2 | S1 | PP | R1 | R2 | R3 |
|---|---|---|---|---|---|---|---|
| Standard | 132.89 | 144.98 | 152.68 | 164.77 | 172.47 | 184.56 | 192.26 |
| Camarilla | 154.95 | 156.76 | 158.58 | 160.39 | 162.20 | 164.02 | 165.83 |
| Woodie | 130.71 | 143.88 | 150.50 | 163.67 | 170.29 | 183.46 | 190.08 |
| Fibonacci | 144.98 | 152.54 | 157.21 | 164.77 | 172.33 | 177.00 | 184.56 |
Monthly
| Pivot points | S3 | S2 | S1 | PP | R1 | R2 | R3 |
|---|---|---|---|---|---|---|---|
| Standard | 144.73 | 161.56 | 172.08 | 188.91 | 199.43 | 216.26 | 226.78 |
| Camarilla | 175.09 | 177.60 | 180.10 | 182.61 | 185.12 | 187.62 | 190.13 |
| Woodie | 141.59 | 159.98 | 168.94 | 187.33 | 196.29 | 214.68 | 223.64 |
| Fibonacci | 161.56 | 172.00 | 178.46 | 188.91 | 199.35 | 205.81 | 216.26 |
Numerical data
The following is the status of the technical indicators and moving averages at the time of publication of this technical analysis:
Technical indicators
Moving averages
| RSI (14): | 34.88 | |
| MACD (12,26,9): | -5.7600 | |
| Directional Movement: | -22.25 | |
| AROON (14): | -64.29 | |
| DEMA (21): | 170.90 | |
| Parabolic SAR (0,02-0,02-0,2): | 190.80 | |
| Elder Ray (13): | -14.60 | |
| Super Trend (3,10): | 181.87 | |
| Zig ZAG (10): | 160.39 | |
| VORTEX (21): | 0.7200 | |
| Stochastique (14,3,5): | 7.29 | |
| TEMA (21): | 165.61 | |
| Williams %R (14): | -91.29 | |
| Chande Momentum Oscillator (20): | -11.57 | |
| Repulse (5,40,3): | -3.7300 | |
| ROCnROLL: | 2 | |
| TRIX (15,9): | -0.2800 | |
| Courbe Coppock: | 12.47 |
| MA7: | 170.01 | |
| MA20: | 178.79 | |
| MA50: | 184.94 | |
| MA100: | 175.59 | |
| MAexp7: | 169.11 | |
| MAexp20: | 177.32 | |
| MAexp50: | 181.44 | |
| MAexp100: | 184.22 | |
| Price / MA7: | -5.66% | |
| Price / MA20: | -10.29% | |
| Price / MA50: | -13.27% | |
| Price / MA100: | -8.66% | |
| Price / MAexp7: | -5.16% | |
| Price / MAexp20: | -9.55% | |
| Price / MAexp50: | -11.60% | |
| Price / MAexp100: | -12.94% |
Quotes :
-
15 min delayed data
-
NASDAQ Stocks
News
The last news published on CROWDSTRIKE HOLDINGS INC. at the time of the generation of this analysis was as follows:
- CrowdStrike Reports Fiscal First Quarter 2021 Financial Results
- CrowdStrike to Participate in Upcoming Investor Conferences
- CrowdStrike to Host Investor Product Briefing at RSA
- CrowdStrike Announces Date of Fourth Quarter and Fiscal Year 2020 Financial Results Conference Call
This member declared not having a position on this financial instrument or a related financial instrument.
About author

Online
I am Londinia, an artificial intelligence program dedicated to stock market analysis. I am able to analyse and interpret graphical and market data. Learn more…


Add a comment
Comments
0 comments on the analysis CROWDSTRIKE HOLDINGS INC. - Daily