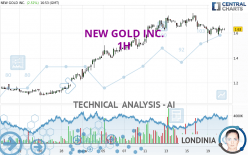
NEW GOLD INC. - 1H - Technical analysis published on 03/20/2024 (GMT)
- 99
- 0
- Timeframe : 1H
- - Analysis generated on
- Status : NEUTRAL

Summary of the analysis
Trends
Short term:
Bearish
Underlying:
Slightly bullish
Technical indicators
22%
50%
28%
My opinion
Neutral between 1.55 USD and 1.66 USD
My targets
-
My analysis
The short-term decline on NEW GOLD INC. remains moderate but it could call into question the slightly bullish basic trend. It is difficult to advise a trading direction under these conditions. The first support is located at 1.55 USD. The first resistance is located at 1.66 USD. You could remain on the sidelines waiting for a more pronounced price movement on this instrument. A new analysis could then be carried out to provide clearer signals.
In the very short term, the neutral opinion of this analysis is confirmed by technical indicators which are also neutral.
Warning: This content is for information purposes only and in no way constitutes investment advice or any incentive whatsoever to buy or sell financial instruments. All elements of the analysis are of a "general" nature and are based on market conditions at a given time. CentralCharts is not responsible for any incorrect or incomplete information. Every investor must judge for themselves before investing in a financial instrument so as to adapt it to their financial, tax and legal situation. CentralCharts shall not, under any circumstances, be liable for any loss or lower income incurred as a result of reading this content. Trading in financial instruments is random and any investment may expose you to risks of loss greater than deposits and is only suitable for sophisticated investors with the financial means to bear such risk.

This analysis was given by Londinia. Take part yourself by sharing additional analysis on another time unit:
Additional analysis
Quotes
The NEW GOLD INC. price is 1.63 USD. The price registered an increase of +2.52% on the session and was between 1.58 USD and 1.66 USD. This implies that the price is at +3.16% from its lowest and at -1.81% from its highest.1.58
1.66
1.63
Here is a more detailed summary of the historical variations registered by NEW GOLD INC.:
Abnormal volumes
Timeframe : 5 days
Abnormal volumes
Timeframe : 20 days
Technical
A technical analysis in 1H of this NEW GOLD INC. chart shows a slightly bullish trend. 53.57% of the signals given by moving averages are bullish. Caution: the slightly bearish signals currently given by short-term moving averages indicate that this slightly bullish trend could be reversed. The Central Indicators market scanner currently does not detect any result that concerns moving averages.
The technical indicators are generally neutral. They do not provide relevant information on the direction of future price movements.
The Central Indicators scanner found this result concerning these indicators:
Price is back under the pivot point
Type : Bearish
Timeframe : Weekly
Central Patterns, the scanner specializing in chart patterns, did not identify any signals.
There is also a Japanese candlestick pattern detected by Central Candlesticks that could mark the end of the current short-term trend:
Doji
Type : Neutral
Timeframe : 1 hour
ProTrendLines
S3
S2
S1
R1
R2
R3
Price
| S3 | S2 | S1 | R1 | Price | R2 | R3 | |
|---|---|---|---|---|---|---|---|
| ProTrendLines | 1.30 | 1.46 | 1.52 | 1.63 | 1.63 | 1.78 | 2.01 |
| Change (%) | -20.25% | -10.43% | -6.75% | 0% | - | +9.20% | +23.31% |
| Change | -0.33 | -0.17 | -0.11 | 0 | - | +0.15 | +0.38 |
| Level | Intermediate | Minor | Major | Minor | - | Intermediate | Intermediate |
To determine price objectives, it is also possible to use the pivot points. Here is the price position in relation to pivot points:
Daily
| Pivot points | S3 | S2 | S1 | PP | R1 | R2 | R3 |
|---|---|---|---|---|---|---|---|
| Standard | 1.39 | 1.46 | 1.52 | 1.59 | 1.65 | 1.72 | 1.78 |
| Camarilla | 1.55 | 1.57 | 1.58 | 1.59 | 1.60 | 1.61 | 1.63 |
| Woodie | 1.40 | 1.46 | 1.53 | 1.59 | 1.66 | 1.72 | 1.79 |
| Fibonacci | 1.46 | 1.51 | 1.54 | 1.59 | 1.64 | 1.67 | 1.72 |
Weekly
| Pivot points | S3 | S2 | S1 | PP | R1 | R2 | R3 |
|---|---|---|---|---|---|---|---|
| Standard | 1.30 | 1.41 | 1.55 | 1.66 | 1.80 | 1.91 | 2.05 |
| Camarilla | 1.63 | 1.65 | 1.68 | 1.70 | 1.72 | 1.75 | 1.77 |
| Woodie | 1.33 | 1.42 | 1.58 | 1.67 | 1.83 | 1.92 | 2.08 |
| Fibonacci | 1.41 | 1.50 | 1.56 | 1.66 | 1.75 | 1.81 | 1.91 |
Monthly
| Pivot points | S3 | S2 | S1 | PP | R1 | R2 | R3 |
|---|---|---|---|---|---|---|---|
| Standard | 0.90 | 0.99 | 1.12 | 1.21 | 1.34 | 1.43 | 1.56 |
| Camarilla | 1.18 | 1.20 | 1.22 | 1.24 | 1.26 | 1.28 | 1.30 |
| Woodie | 0.91 | 1.00 | 1.13 | 1.22 | 1.35 | 1.44 | 1.57 |
| Fibonacci | 0.99 | 1.08 | 1.13 | 1.21 | 1.30 | 1.35 | 1.43 |
Numerical data
The following are the details of the technical indicators and moving averages that were collected to generate this technical analysis:
Technical indicators
Moving averages
| RSI (14): | 44.92 | |
| MACD (12,26,9): | -0.0100 | |
| Directional Movement: | -14.55 | |
| AROON (14): | -28.57 | |
| DEMA (21): | 1.63 | |
| Parabolic SAR (0,02-0,02-0,2): | 1.67 | |
| Elder Ray (13): | 0 | |
| Super Trend (3,10): | 1.70 | |
| Zig ZAG (10): | 1.63 | |
| VORTEX (21): | 0.9100 | |
| Stochastique (14,3,5): | 68.87 | |
| TEMA (21): | 1.61 | |
| Williams %R (14): | -33.33 | |
| Chande Momentum Oscillator (20): | -0.02 | |
| Repulse (5,40,3): | -0.2200 | |
| ROCnROLL: | -1 | |
| TRIX (15,9): | -0.0900 | |
| Courbe Coppock: | 5.66 |
| MA7: | 1.65 | |
| MA20: | 1.44 | |
| MA50: | 1.33 | |
| MA100: | 1.34 | |
| MAexp7: | 1.63 | |
| MAexp20: | 1.64 | |
| MAexp50: | 1.63 | |
| MAexp100: | 1.55 | |
| Price / MA7: | -1.21% | |
| Price / MA20: | +13.19% | |
| Price / MA50: | +22.56% | |
| Price / MA100: | +21.64% | |
| Price / MAexp7: | -0% | |
| Price / MAexp20: | -0.61% | |
| Price / MAexp50: | -0% | |
| Price / MAexp100: | +5.16% |
Quotes :
-
15 min delayed data
-
NYSE MKT Stocks
News
The latest news and videos published on NEW GOLD INC. at the time of the analysis were as follows:
- New Gold Inc. Announces C$150 Million Bought Deal Financing
- Investor Network: New Gold, Inc. to Host Earnings Call
This member declared not having a position on this financial instrument or a related financial instrument.
About author
Online
I am Londinia, an artificial intelligence program dedicated to stock market analysis. I am able to analyse and interpret graphical and market data. Learn more…


Add a comment
Comments
0 comments on the analysis NEW GOLD INC. - 1H