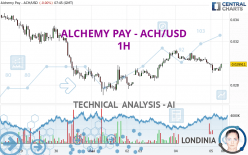
ALCHEMY PAY - ACH/USD - 1H - Technical analysis published on 05/05/2024 (GMT)
- 112
- 0
Click here for a new analysis!
- Timeframe : 1H
- - Analysis generated on
- Status : INVALID

Summary of the analysis

Additional analysis
Quotes
The ALCHEMY PAY - ACH/USD price is 0.029911 USD. On the day, this instrument gained +0.00% and was traded between 0.029113 USD and 0.030000 USD over the period. The price is currently at +2.74% from its lowest and -0.30% from its highest.A bullish opening was detected by the Central Gaps scanner. Buyers are trying to impose a bullish momentum in the very short term.
Bullish opening
Type : Bullish
Timeframe : Openning
So that you have an overall view of the price change, here is a table showing the variations over several periods:
Technical
A technical analysis in 1H of this ALCHEMY PAY - ACH/USD chart shows a slightly bearish trend. 57.14% of the signals given by moving averages are bearish. This bearish trend does not seem to be increasing given the slightly bearish signals given by short-term moving averages. The Central Indicators scanner detects bullish and bearish signals on moving averages that could impact this trend:
Bullish trend reversal : Moving Average 100
Type : Bullish
Timeframe : 1 hour
Moving Average bearish crossovers : MA20 & MA50
Type : Bearish
Timeframe : 1 hour
In fact, only 9 technical indicators out of 18 studied are currently positioned bearish. Caution: the Central Indicators scanner currently detects an excess:
RSI indicator is overbought : over 70
Type : Neutral
Timeframe : 1 hour
CCI indicator is overbought : over 100
Type : Neutral
Timeframe : 1 hour
CCI indicator: bearish divergence
Type : Bearish
Timeframe : 1 hour
RSI indicator: bullish divergence
Type : Bullish
Timeframe : 1 hour
Williams %R indicator is overbought : over -20
Type : Neutral
Timeframe : 1 hour
Pivot points : price is over resistance 2
Type : Neutral
Timeframe : 1 hour
Pivot points : price is under support 1
Type : Neutral
Timeframe : Weekly
The Central Patterns scanner, which studies chart patterns, resistances and supports, has identified this signal:
Resistance of channel is broken
Type : Bullish
Timeframe : 1 hour
The Central Candlesticks scanner, specialised in Japanese candlesticks, did not identify any signals.
| S3 | S2 | S1 | Price | R1 | R2 | R3 | |
|---|---|---|---|---|---|---|---|
| ProTrendLines | 0.023769 | 0.027064 | 0.028353 | 0.029911 | 0.030278 | 0.032654 | 0.035870 |
| Change (%) | -20.53% | -9.52% | -5.21% | - | +1.23% | +9.17% | +19.92% |
| Change | -0.006142 | -0.002847 | -0.001558 | - | +0.000367 | +0.002743 | +0.005959 |
| Level | Major | Minor | Intermediate | - | Intermediate | Minor | Major |
To determine price objectives, it is also possible to use the pivot points. Here is the price position in relation to pivot points:
| Pivot points | S3 | S2 | S1 | PP | R1 | R2 | R3 |
|---|---|---|---|---|---|---|---|
| Standard | 0.028120 | 0.029006 | 0.029459 | 0.030345 | 0.030798 | 0.031684 | 0.032137 |
| Camarilla | 0.029544 | 0.029667 | 0.029789 | 0.029912 | 0.030035 | 0.030158 | 0.030280 |
| Woodie | 0.027904 | 0.028898 | 0.029243 | 0.030237 | 0.030582 | 0.031576 | 0.031921 |
| Fibonacci | 0.029006 | 0.029518 | 0.029834 | 0.030345 | 0.030857 | 0.031173 | 0.031684 |
| Pivot points | S3 | S2 | S1 | PP | R1 | R2 | R3 |
|---|---|---|---|---|---|---|---|
| Standard | 0.017635 | 0.022349 | 0.026131 | 0.030845 | 0.034627 | 0.039341 | 0.043123 |
| Camarilla | 0.027576 | 0.028354 | 0.029133 | 0.029912 | 0.030691 | 0.031470 | 0.032248 |
| Woodie | 0.017168 | 0.022116 | 0.025664 | 0.030612 | 0.034160 | 0.039108 | 0.042656 |
| Fibonacci | 0.022349 | 0.025595 | 0.027600 | 0.030845 | 0.034091 | 0.036096 | 0.039341 |
| Pivot points | S3 | S2 | S1 | PP | R1 | R2 | R3 |
|---|---|---|---|---|---|---|---|
| Standard | 0.001805 | 0.011224 | 0.020230 | 0.029649 | 0.038655 | 0.048074 | 0.057080 |
| Camarilla | 0.024168 | 0.025857 | 0.027546 | 0.029235 | 0.030924 | 0.032613 | 0.034302 |
| Woodie | 0.001598 | 0.011121 | 0.020023 | 0.029546 | 0.038448 | 0.047971 | 0.056873 |
| Fibonacci | 0.011224 | 0.018263 | 0.022611 | 0.029649 | 0.036688 | 0.041036 | 0.048074 |
Numerical data
The following is the status of the technical indicators and moving averages at the time of publication of this technical analysis:
| RSI (14): | 43.32 | |
| MACD (12,26,9): | -0.0002 | |
| Directional Movement: | -11.820553 | |
| AROON (14): | -35.714286 | |
| DEMA (21): | 0.029627 | |
| Parabolic SAR (0,02-0,02-0,2): | 0.029718 | |
| Elder Ray (13): | -0.000105 | |
| Super Trend (3,10): | 0.030395 | |
| Zig ZAG (10): | 0.029604 | |
| VORTEX (21): | 0.8887 | |
| Stochastique (14,3,5): | 27.63 | |
| TEMA (21): | 0.029345 | |
| Williams %R (14): | -67.39 | |
| Chande Momentum Oscillator (20): | -0.000775 | |
| Repulse (5,40,3): | -0.0505 | |
| ROCnROLL: | 2 | |
| TRIX (15,9): | -0.0690 | |
| Courbe Coppock: | 5.67 |
| MA7: | 0.030018 | |
| MA20: | 0.032158 | |
| MA50: | 0.034388 | |
| MA100: | 0.029937 | |
| MAexp7: | 0.029572 | |
| MAexp20: | 0.029846 | |
| MAexp50: | 0.029912 | |
| MAexp100: | 0.030173 | |
| Price / MA7: | -0.36% | |
| Price / MA20: | -6.99% | |
| Price / MA50: | -13.02% | |
| Price / MA100: | -0.09% | |
| Price / MAexp7: | +1.15% | |
| Price / MAexp20: | +0.22% | |
| Price / MAexp50: | +0.00% | |
| Price / MAexp100: | -0.87% |
About author
Online


Add a comment
Comments
0 comments on the analysis ALCHEMY PAY - ACH/USD - 1H