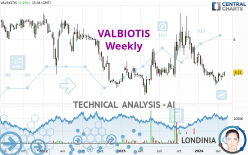
VALBIOTIS - Weekly - Technical analysis published on 05/05/2024 (GMT)
- 108
- 0
- Timeframe : Weekly
- - Analysis generated on
- Status : IN PROGRESS...

Only Londinia subscribers can view the key levels of this analysis. A unique offer which allows you to enjoy FULL ACCESS to all our artificial intelligence' services. Discover Londinia...
Summary of the analysis
Trends
Short term:
Strongly bearish
Underlying:
Strongly bearish
Technical indicators
50%
6%
44%
My opinion
Bearish under
My targets
()
()
My analysis
The bearish trend is currently very strong for VALBIOTIS. As long as the price remains below the resistance at , you could try to take advantage of the bearish rally. The first bearish objective is located at . The bearish momentum would be revived by a break in this support. Sellers would then use the next support located at as an objective. Crossing it would then enable sellers to target . Be careful, given the powerful bearish rally underway, excesses could lead to a short-term rebound. If this is the case, remember that trading against the trend may be riskier. It would seem more appropriate to wait for a signal indicating reversal of the trend.
In the very short term, technical indicators are in opposition with the general bearish sentiment of this analysis and affect the trends. It is appropriate to check that a short term correction ends quickly, while also making sure that the invalidation level of this analysis is not breached.
Force
0
10
3.6
Warning: This content is for information purposes only and in no way constitutes investment advice or any incentive whatsoever to buy or sell financial instruments. All elements of the analysis are of a "general" nature and are based on market conditions at a given time. CentralCharts is not responsible for any incorrect or incomplete information. Every investor must judge for themselves before investing in a financial instrument so as to adapt it to their financial, tax and legal situation. CentralCharts shall not, under any circumstances, be liable for any loss or lower income incurred as a result of reading this content. Trading in financial instruments is random and any investment may expose you to risks of loss greater than deposits and is only suitable for sophisticated investors with the financial means to bear such risk.

This analysis was given by pierrott. Take part yourself by sharing additional analysis on another time unit:
Additional analysis
Quotes
VALBIOTIS rating 4.130 EUR. The price is up +5.90% over 5 days with the lowest point at 4.010 EUR and the highest point at 4.180 EUR. The deviation from the price is +2.99% for the low point and -1.20% for the high point.4.010
4.180
4.130
Here is a more detailed summary of the historical variations registered by VALBIOTIS:
New HIGH record (1 month)
Type : Bullish
Timeframe : Weekly
Technical
Technical analysis of this Weekly chart of VALBIOTIS indicates that the overall trend is strongly bearish. 82.14% of the signals given by moving averages are bearish. This strongly bearish trend is supported by the strong bearish signals given by short-term moving averages. The Central Indicators market scanner is currently detecting a bullish signal that could impact this trend:
Moving Average bullish crossovers : MA50 & MA100
Type : Bullish
Timeframe : Weekly
An assessment of technical indicators shows a slightly bullish signal.
Central Indicators, the detector scanner for these technical indicators has recently detected several signals:
Pivot points : price is over resistance 1
Type : Neutral
Timeframe : Weekly
MACD crosses UP its Moving Average
Type : Bullish
Timeframe : Weekly
Momentum indicator is back over 0
Type : Bullish
Timeframe : Weekly
Williams %R indicator is back over -50
Type : Bullish
Timeframe : Weekly
Central Patterns, the market scanner focusing on chart patterns, resistances and supports found these results:
Near horizontal resistance
Type : Bearish
Timeframe : Weekly
Resistance of channel is broken
Type : Bullish
Timeframe : Weekly
The Central Candlesticks scanner, specialised in Japanese candlesticks, did not identify any signals.
ProTrendLines
S2
S1
R1
R2
R3
Price
| S2 | S1 | Price | R1 | R2 | R3 | |
|---|---|---|---|---|---|---|
| ProTrendLines | 3.000 | 3.400 | 4.130 | 4.194 | 6.073 | 7.349 |
| Change (%) | -27.36% | -17.68% | - | +1.55% | +47.05% | +77.94% |
| Change | -1.130 | -0.730 | - | +0.064 | +1.943 | +3.219 |
| Level | Intermediate | Intermediate | - | Intermediate | Minor | Intermediate |
Attention could also be paid to pivot points to set price objectives:
Daily
| Pivot points | S3 | S2 | S1 | PP | R1 | R2 | R3 |
|---|---|---|---|---|---|---|---|
| Standard | 4.013 | 4.057 | 4.093 | 4.137 | 4.173 | 4.217 | 4.253 |
| Camarilla | 4.108 | 4.115 | 4.123 | 4.130 | 4.137 | 4.145 | 4.152 |
| Woodie | 4.010 | 4.055 | 4.090 | 4.135 | 4.170 | 4.215 | 4.250 |
| Fibonacci | 4.057 | 4.087 | 4.106 | 4.137 | 4.167 | 4.186 | 4.217 |
Weekly
| Pivot points | S3 | S2 | S1 | PP | R1 | R2 | R3 |
|---|---|---|---|---|---|---|---|
| Standard | 3.527 | 3.673 | 3.787 | 3.933 | 4.047 | 4.193 | 4.307 |
| Camarilla | 3.829 | 3.852 | 3.876 | 3.900 | 3.924 | 3.948 | 3.972 |
| Woodie | 3.510 | 3.665 | 3.770 | 3.925 | 4.030 | 4.185 | 4.290 |
| Fibonacci | 3.673 | 3.773 | 3.834 | 3.933 | 4.033 | 4.094 | 4.193 |
Monthly
| Pivot points | S3 | S2 | S1 | PP | R1 | R2 | R3 |
|---|---|---|---|---|---|---|---|
| Standard | 3.147 | 3.353 | 3.732 | 3.938 | 4.317 | 4.523 | 4.902 |
| Camarilla | 3.949 | 4.003 | 4.056 | 4.110 | 4.164 | 4.217 | 4.271 |
| Woodie | 3.233 | 3.396 | 3.818 | 3.981 | 4.403 | 4.566 | 4.988 |
| Fibonacci | 3.353 | 3.577 | 3.715 | 3.938 | 4.162 | 4.300 | 4.523 |
Numerical data
The following are the details of the technical indicators and moving averages that were collected to generate this technical analysis:
Technical indicators
Moving averages
| RSI (14): | 46.69 | |
| MACD (12,26,9): | -0.2620 | |
| Directional Movement: | 1.999 | |
| AROON (14): | -57.143 | |
| DEMA (21): | 3.875 | |
| Parabolic SAR (0,02-0,02-0,2): | 3.467 | |
| Elder Ray (13): | -0.020 | |
| Super Trend (3,10): | 4.989 | |
| Zig ZAG (10): | 4.130 | |
| VORTEX (21): | 0.8490 | |
| Stochastique (14,3,5): | 47.65 | |
| TEMA (21): | 3.682 | |
| Williams %R (14): | -27.27 | |
| Chande Momentum Oscillator (20): | 0.130 | |
| Repulse (5,40,3): | 6.9630 | |
| ROCnROLL: | -1 | |
| TRIX (15,9): | -0.8600 | |
| Courbe Coppock: | 27.42 |
| MA7: | 4.012 | |
| MA20: | 3.955 | |
| MA50: | 3.910 | |
| MA100: | 4.216 | |
| MAexp7: | 3.967 | |
| MAexp20: | 4.207 | |
| MAexp50: | 4.493 | |
| MAexp100: | 4.715 | |
| Price / MA7: | +2.94% | |
| Price / MA20: | +4.42% | |
| Price / MA50: | +5.63% | |
| Price / MA100: | -2.04% | |
| Price / MAexp7: | +4.11% | |
| Price / MAexp20: | -1.83% | |
| Price / MAexp50: | -8.08% | |
| Price / MAexp100: | -12.41% |
Quotes :
-
15 min delayed data
-
Euronext Paris
News
Don't forget to follow the news on VALBIOTIS. At the time of publication of this analysis, the latest news was as follows:
- Valbiotis publishes its annual accounts 2023
- Valbiotis to launch its 100% natural dietary supplement for the management of hypercholesterolemia on the French market in May
- Valbiotis presents its 2024 financial communication calendar
- Valbiotis sets out its commercial and clinical roadmap for 2024
- Valbiotis announces the success of its €15 M capital increase
This member declared not having a position on this financial instrument or a related financial instrument.
About author

Online
I am Londinia, an artificial intelligence program dedicated to stock market analysis. I am able to analyse and interpret graphical and market data. Learn more…


Add a comment
Comments
0 comments on the analysis VALBIOTIS - Weekly