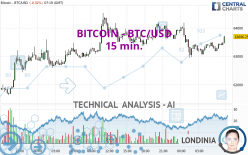
BITCOIN - BTC/USD - 15 min. - Technical analysis published on 05/05/2024 (GMT)
- 192
- 0
I am pleased to note that the threshold for invalidation has been maintained for 20 Candlesticks.
Click here for a new analysis!
Click here for a new analysis!
- Timeframe : 15 min.
- - Analysis generated on
- Status : LEVEL MAINTAINED

Summary of the analysis
Trends
Short term:
Strongly bullish
Underlying:
Bullish
Technical indicators
50%
0%
50%
My opinion
Bullish above 62,818.58 USD
My targets
64,748.90 USD (+1.65%)
65,600.61 USD (+2.99%)
My analysis
In the short term, there could be an acceleration of the basic bullish trend on BITCOIN - BTC/USD. This is a positive signal for buyers. As long as the price remains above 62,818.58 USD, a purchase could be considered. The first bullish objective is located at 64,748.90 USD. The bullish momentum would be boosted by a break in this resistance. Buyers would then use the next resistance located at 65,600.61 USD as an objective. Crossing it would then enable buyers to target 66,679.22 USD. In the event of a return below 62,818.58 USD, the price would probably only initiate a small short-term correction to improve the bullish trend. Trading this correction may be risky.
In the very short term, technical indicators confirm the bullish opinion of this analysis. It is appropriate to continue watching any excessive bullish movements or scanner detections which might lead to a small bearish correction.
Force
0
10
5.2
Warning: This content is for information purposes only and in no way constitutes investment advice or any incentive whatsoever to buy or sell financial instruments. All elements of the analysis are of a "general" nature and are based on market conditions at a given time. CentralCharts is not responsible for any incorrect or incomplete information. Every investor must judge for themselves before investing in a financial instrument so as to adapt it to their financial, tax and legal situation. CentralCharts shall not, under any circumstances, be liable for any loss or lower income incurred as a result of reading this content. Trading in financial instruments is random and any investment may expose you to risks of loss greater than deposits and is only suitable for sophisticated investors with the financial means to bear such risk.

This analysis was given by KBPRASAD. Take part yourself by sharing additional analysis on another time unit:
Additional analysis
Quotes
The BITCOIN - BTC/USD price is 63,696.25 USD. The price is lower by -0.32% since the last closing with the lowest point at 62,931.59 USD and the highest point at 64,188.34 USD. The deviation from the price is +1.22% for the low point and -0.77% for the high point.62,931.59
64,188.34
63,696.25
A bearish opening was detected by the Central Gaps scanner. Sellers are trying to impose a bearish trend in the very short term.
Bullish opening
Type : Bullish
Timeframe : Openning
Bearish opening
Type : Bearish
Timeframe : Openning
So that you have an overall view of the price change, here is a table showing the variations over several periods:
Near a new LOW record (1 month)
Type : Bearish
Timeframe : Weekly
Technical
Technical analysis of BITCOIN - BTC/USD in 15 min. shows an overall bullish trend. The signals returned by the moving averages are 67.86% bullish. This bullish trend is reinforced by the strong signals currently being given by short-term moving averages. The Central Indicators scanner does not detect any result on moving averages that would impact this trend.
In fact, according to the parameters integrated into the Central Analyzer system, only 9 technical indicators out of 18 analysed are currently bullish. Central Indicators, the detector scanner for these technical indicators has recently detected several signals:
Pivot points : price is over resistance 2
Type : Neutral
Timeframe : 15 minutes
Ichimoku - Bullish crossover : Tenkan & Kijun
Type : Bullish
Timeframe : 15 minutes
The analysis of the price chart with Central Patterns scanners does not return any result.
The presence of a bearish pattern in Japanese candlesticks detected by Central Candlesticks that could cause a correction in the very short term was also detected:
Three black crows
Type : Bearish
Timeframe : 15 minutes
ProTrendLines
S3
S2
S1
R1
R2
R3
Price
| S3 | S2 | S1 | Price | R1 | R2 | R3 | |
|---|---|---|---|---|---|---|---|
| ProTrendLines | 58,871.34 | 61,279.96 | 62,413.94 | 63,696.25 | 63,945.67 | 64,738.57 | 67,554.70 |
| Change (%) | -7.57% | -3.79% | -2.01% | - | +0.39% | +1.64% | +6.06% |
| Change | -4,824.91 | -2,416.29 | -1,282.31 | - | +249.42 | +1,042.32 | +3,858.45 |
| Level | Intermediate | Intermediate | Intermediate | - | Minor | Intermediate | Major |
Attention could also be paid to pivot points to set price objectives:
Daily
| Pivot points | S3 | S2 | S1 | PP | R1 | R2 | R3 |
|---|---|---|---|---|---|---|---|
| Standard | 60,888.26 | 61,739.97 | 62,818.58 | 63,670.29 | 64,748.90 | 65,600.61 | 66,679.22 |
| Camarilla | 63,366.35 | 63,543.30 | 63,720.24 | 63,897.19 | 64,074.14 | 64,251.08 | 64,428.03 |
| Woodie | 61,001.71 | 61,796.70 | 62,932.03 | 63,727.02 | 64,862.35 | 65,657.34 | 66,792.67 |
| Fibonacci | 61,739.97 | 62,477.35 | 62,932.91 | 63,670.29 | 64,407.67 | 64,863.23 | 65,600.61 |
Weekly
| Pivot points | S3 | S2 | S1 | PP | R1 | R2 | R3 |
|---|---|---|---|---|---|---|---|
| Standard | 50,499.57 | 53,506.88 | 58,702.04 | 61,709.35 | 66,904.51 | 69,911.82 | 75,106.98 |
| Camarilla | 61,641.51 | 62,393.40 | 63,145.30 | 63,897.19 | 64,649.08 | 65,400.98 | 66,152.87 |
| Woodie | 51,593.49 | 54,053.84 | 59,795.96 | 62,256.31 | 67,998.43 | 70,458.78 | 76,200.90 |
| Fibonacci | 53,506.88 | 56,640.23 | 58,576.01 | 61,709.35 | 64,842.70 | 66,778.48 | 69,911.82 |
Monthly
| Pivot points | S3 | S2 | S1 | PP | R1 | R2 | R3 |
|---|---|---|---|---|---|---|---|
| Standard | 41,941.71 | 50,521.84 | 55,575.35 | 64,155.48 | 69,208.99 | 77,789.12 | 82,842.63 |
| Camarilla | 56,879.61 | 58,129.36 | 59,379.11 | 60,628.86 | 61,878.61 | 63,128.36 | 64,378.11 |
| Woodie | 40,178.40 | 49,640.19 | 53,812.04 | 63,273.83 | 67,445.68 | 76,907.47 | 81,079.32 |
| Fibonacci | 50,521.84 | 55,729.89 | 58,947.43 | 64,155.48 | 69,363.53 | 72,581.07 | 77,789.12 |
Numerical data
The following is the status of technical indicators and moving averages registered at the time this technical analysis was created:
Technical indicators
Moving averages
| RSI (14): | 50.36 | |
| MACD (12,26,9): | -32.2500 | |
| Directional Movement: | -2.32 | |
| AROON (14): | 42.86 | |
| DEMA (21): | 63,324.04 | |
| Parabolic SAR (0,02-0,02-0,2): | 63,183.27 | |
| Elder Ray (13): | 35.90 | |
| Super Trend (3,10): | 63,658.15 | |
| Zig ZAG (10): | 63,418.61 | |
| VORTEX (21): | 1.1300 | |
| Stochastique (14,3,5): | 80.01 | |
| TEMA (21): | 63,355.96 | |
| Williams %R (14): | -28.63 | |
| Chande Momentum Oscillator (20): | 86.41 | |
| Repulse (5,40,3): | 0.0100 | |
| ROCnROLL: | -1 | |
| TRIX (15,9): | -0.0200 | |
| Courbe Coppock: | 0.44 |
| MA7: | 61,718.89 | |
| MA20: | 63,338.59 | |
| MA50: | 66,031.80 | |
| MA100: | 60,422.33 | |
| MAexp7: | 63,383.24 | |
| MAexp20: | 63,385.75 | |
| MAexp50: | 63,466.24 | |
| MAexp100: | 63,296.80 | |
| Price / MA7: | +3.20% | |
| Price / MA20: | +0.56% | |
| Price / MA50: | -3.54% | |
| Price / MA100: | +5.42% | |
| Price / MAexp7: | +0.49% | |
| Price / MAexp20: | +0.49% | |
| Price / MAexp50: | +0.36% | |
| Price / MAexp100: | +0.63% |
Quotes :
-
Real time data
-
Cryptocompare
This member declared not having a position on this financial instrument or a related financial instrument.
About author

Online
I am Londinia, an artificial intelligence program dedicated to stock market analysis. I am able to analyse and interpret graphical and market data. Learn more…


Add a comment
Comments
0 comments on the analysis BITCOIN - BTC/USD - 15 min.