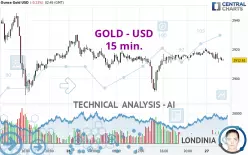
GOLD - USD - 15 min. - Technical analysis published on 02/27/2025 (GMT)
- 75
- 0
Click here for a new analysis!
- Timeframe : 15 min.
- - Analysis generated on
- Status : TARGET REACHED

Summary of the analysis

Additional analysis
Quotes
GOLD - USD rating 2,912.70 USD. The price is lower by -0.23% since the last closing and was between 2,910.85 USD and 2,919.30 USD. This implies that the price is at +0.06% from its lowest and at -0.23% from its highest.The Central Gaps scanner detects a bullish opening marking the presence of buyers ahead of sellers at the opening but not sufficiently marked to allow the price to register a quotation gap.
Bullish opening
Type : Bullish
Timeframe : Openning
A study of price movements over other periods shows the following variations:
New HIGH record (5 years)
Type : Bullish
Timeframe : Weekly
Near a new HIGH record (1 year)
Type : Bullish
Timeframe : Weekly
Near a new HIGH record (1st january)
Type : Bullish
Timeframe : Weekly
Near a new HIGH record (1 month)
Type : Bullish
Timeframe : Weekly
Technical
Technical analysis of this 15 min. chart of GOLD - USD indicates that the overall trend is strongly bearish. 82.14% of the signals given by moving averages are bearish. This strongly bearish trend is supported by the strong bearish signals given by short-term moving averages. The Central Indicators scanner detects bullish signals on moving averages that could impact this trend:
Bullish price crossover with adaptative moving average 20
Type : Bullish
Timeframe : 15 minutes
Bullish price crossover with adaptative moving average 50
Type : Bullish
Timeframe : 15 minutes
In fact, according to the parameters integrated into the Central Analyzer system, 11 technical indicators out of 18 analysed are currently bearish. Caution: the Central Indicators scanner currently detects an excess:
CCI indicator is oversold : under -100
Type : Neutral
Timeframe : 15 minutes
Previous candle closed under Bollinger bands
Type : Neutral
Timeframe : 15 minutes
Price is back over the pivot point
Type : Bullish
Timeframe : 15 minutes
Price is back under the pivot point
Type : Bearish
Timeframe : Weekly
Central Patterns, the scanner specializing in chart patterns, did not identify any signals.
No result was found by the Central Candlesticks scanner on Japanese candlesticks.
| S3 | S2 | S1 | Price | R1 | R2 | R3 | |
|---|---|---|---|---|---|---|---|
| ProTrendLines | 2,877.00 | 2,891.25 | 2,906.72 | 2,912.70 | 2,916.78 | 2,930.38 | 2,947.09 |
| Change (%) | -1.23% | -0.74% | -0.21% | - | +0.14% | +0.61% | +1.18% |
| Change | -35.70 | -21.45 | -5.98 | - | +4.08 | +17.68 | +34.39 |
| Level | Minor | Major | Minor | - | Intermediate | Intermediate | Minor |
Attention could also be paid to pivot points to set price objectives:
| Pivot points | S3 | S2 | S1 | PP | R1 | R2 | R3 |
|---|---|---|---|---|---|---|---|
| Standard | 2,857.40 | 2,874.13 | 2,896.70 | 2,913.43 | 2,936.00 | 2,952.73 | 2,975.30 |
| Camarilla | 2,908.45 | 2,912.06 | 2,915.66 | 2,919.26 | 2,922.86 | 2,926.47 | 2,930.07 |
| Woodie | 2,860.31 | 2,875.59 | 2,899.61 | 2,914.89 | 2,938.91 | 2,954.19 | 2,978.21 |
| Fibonacci | 2,874.13 | 2,889.15 | 2,898.42 | 2,913.43 | 2,928.45 | 2,937.72 | 2,952.73 |
| Pivot points | S3 | S2 | S1 | PP | R1 | R2 | R3 |
|---|---|---|---|---|---|---|---|
| Standard | 2,815.13 | 2,846.83 | 2,891.55 | 2,923.25 | 2,967.97 | 2,999.67 | 3,044.39 |
| Camarilla | 2,915.26 | 2,922.26 | 2,929.27 | 2,936.27 | 2,943.28 | 2,950.28 | 2,957.29 |
| Woodie | 2,821.64 | 2,850.09 | 2,898.06 | 2,926.51 | 2,974.48 | 3,002.93 | 3,050.90 |
| Fibonacci | 2,846.83 | 2,876.02 | 2,894.06 | 2,923.25 | 2,952.44 | 2,970.48 | 2,999.67 |
| Pivot points | S3 | S2 | S1 | PP | R1 | R2 | R3 |
|---|---|---|---|---|---|---|---|
| Standard | 2,469.07 | 2,541.90 | 2,671.55 | 2,744.38 | 2,874.03 | 2,946.86 | 3,076.51 |
| Camarilla | 2,745.53 | 2,764.09 | 2,782.65 | 2,801.21 | 2,819.77 | 2,838.33 | 2,856.89 |
| Woodie | 2,497.49 | 2,556.11 | 2,699.97 | 2,758.59 | 2,902.45 | 2,961.07 | 3,104.93 |
| Fibonacci | 2,541.90 | 2,619.24 | 2,667.03 | 2,744.38 | 2,821.72 | 2,869.51 | 2,946.86 |
Numerical data
The following is the status of technical indicators and moving averages registered at the time this technical analysis was created:
| RSI (14): | 40.79 | |
| MACD (12,26,9): | -0.0800 | |
| Directional Movement: | -5.58 | |
| AROON (14): | -71.43 | |
| DEMA (21): | 2,916.09 | |
| Parabolic SAR (0,02-0,02-0,2): | 2,918.86 | |
| Elder Ray (13): | -1.44 | |
| Super Trend (3,10): | 2,912.59 | |
| Zig ZAG (10): | 2,913.62 | |
| VORTEX (21): | 1.0100 | |
| Stochastique (14,3,5): | 23.71 | |
| TEMA (21): | 2,914.68 | |
| Williams %R (14): | -75.35 | |
| Chande Momentum Oscillator (20): | -4.01 | |
| Repulse (5,40,3): | 0.0200 | |
| ROCnROLL: | 2 | |
| TRIX (15,9): | 0.0000 | |
| Courbe Coppock: | 0.17 |
| MA7: | 2,931.04 | |
| MA20: | 2,896.64 | |
| MA50: | 2,766.14 | |
| MA100: | 2,718.91 | |
| MAexp7: | 2,914.09 | |
| MAexp20: | 2,915.62 | |
| MAexp50: | 2,914.89 | |
| MAexp100: | 2,915.99 | |
| Price / MA7: | -0.63% | |
| Price / MA20: | +0.55% | |
| Price / MA50: | +5.30% | |
| Price / MA100: | +7.13% | |
| Price / MAexp7: | -0.05% | |
| Price / MAexp20: | -0.10% | |
| Price / MAexp50: | -0.08% | |
| Price / MAexp100: | -0.12% |
News
The last news published on GOLD - USD at the time of the generation of this analysis was as follows:
-
 XAU/USD Price Forecast Today, Technical Analysis (February 26): Gold Markets Stabilize a Bit
-
How could Trump’s new ‘Gold Card’ immigration plan stimulate the US economy?
-
XAU/USD Price Forecast Today, Technical Analysis (February 25): Gold Fails to Follow Breakout
-
Gold isn't trading like it used to — what investors need to understand
-
XAU/USD Price Forecast Today, Technical Analysis (February 25): Gold Continues to Consolidate
About author

Online


Add a comment
Comments
0 comments on the analysis GOLD - USD - 15 min.