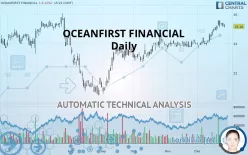
OCEANFIRST FINANCIAL - Daily - Technical analysis published on 12/27/2019 (GMT)
- 140
- 0
- Who voted?
Click here for a new analysis!
- Timeframe : Daily
- - Analysis generated on
- Status : LEVEL MAINTAINED

Summary of the analysis

Additional analysis
Quotes
The OCEANFIRST FINANCIAL price is 25.18 USD. The price registered a decrease of -0.12% on the session and was traded between 25.10 USD and 25.30 USD over the period. The price is currently at +0.32% from its lowest and -0.47% from its highest.A bullish opening was detected by the Central Gaps scanner. Buyers are trying to impose a bullish momentum in the very short term.
Bullish opening
Type : Bullish
Timeframe : Openning
So that you have an overall view of the price change, here is a table showing the variations over several periods:
Near a new HIGH record (1 year)
Type : Bullish
Timeframe : Weekly
Near a new HIGH record (1st january)
Type : Bullish
Timeframe : Weekly
Near a new HIGH record (1 month)
Type : Bullish
Timeframe : Weekly
Technical
Technical analysis of this Daily chart of OCEANFIRST FINANCIAL indicates that the overall trend is strongly bullish. The signals given by the moving averages are 92.86% bullish. This strong bullish trend is confirmed by the strong signals currently being given by short-term moving averages. The Central Indicators market scanner currently does not detect any result that concerns moving averages.
In fact, 13 technical indicators on 18 studied are currently bullish. But beware of excesses. The Central Indicators scanner currently detects this:
Williams %R indicator is overbought : over -20
Type : Neutral
Timeframe : Daily
Price is back over the pivot point
Type : Bullish
Timeframe : Weekly
Central Patterns, the market scanner focusing on chart patterns, resistances and supports found this result:
Near horizontal support
Type : Bullish
Timeframe : Daily
For a small rebound in the very short term, the Central Candlesticks scanner currently notes the presence of this bullish pattern in Japanese candlesticks:
Bullish harami
Type : Bullish
Timeframe : Daily
| S3 | S2 | S1 | Price | R1 | R2 | R3 | |
|---|---|---|---|---|---|---|---|
| ProTrendLines | 23.79 | 24.25 | 25.15 | 25.18 | 25.88 | 27.99 | 29.12 |
| Change (%) | -5.52% | -3.69% | -0.12% | - | +2.78% | +11.16% | +15.65% |
| Change | -1.39 | -0.93 | -0.03 | - | +0.70 | +2.81 | +3.94 |
| Level | Major | Major | Intermediate | - | Major | Minor | Minor |
Attention could also be paid to pivot points to set price objectives:
| Pivot points | S3 | S2 | S1 | PP | R1 | R2 | R3 |
|---|---|---|---|---|---|---|---|
| Standard | 24.81 | 24.98 | 25.09 | 25.26 | 25.37 | 25.54 | 25.65 |
| Camarilla | 25.13 | 25.16 | 25.18 | 25.21 | 25.24 | 25.26 | 25.29 |
| Woodie | 24.79 | 24.97 | 25.07 | 25.25 | 25.35 | 25.53 | 25.63 |
| Fibonacci | 24.98 | 25.08 | 25.15 | 25.26 | 25.36 | 25.43 | 25.54 |
| Pivot points | S3 | S2 | S1 | PP | R1 | R2 | R3 |
|---|---|---|---|---|---|---|---|
| Standard | 23.84 | 24.21 | 24.88 | 25.25 | 25.92 | 26.29 | 26.96 |
| Camarilla | 25.27 | 25.37 | 25.47 | 25.56 | 25.66 | 25.75 | 25.85 |
| Woodie | 24.00 | 24.29 | 25.04 | 25.33 | 26.08 | 26.37 | 27.12 |
| Fibonacci | 24.21 | 24.60 | 24.85 | 25.25 | 25.64 | 25.89 | 26.29 |
| Pivot points | S3 | S2 | S1 | PP | R1 | R2 | R3 |
|---|---|---|---|---|---|---|---|
| Standard | 22.98 | 23.31 | 23.64 | 23.97 | 24.30 | 24.63 | 24.96 |
| Camarilla | 23.80 | 23.86 | 23.92 | 23.98 | 24.04 | 24.10 | 24.16 |
| Woodie | 22.99 | 23.31 | 23.65 | 23.97 | 24.31 | 24.63 | 24.97 |
| Fibonacci | 23.31 | 23.56 | 23.72 | 23.97 | 24.22 | 24.38 | 24.63 |
Numerical data
The following is the status of technical indicators and moving averages registered at the time this technical analysis was created:
| RSI (14): | 64.01 | |
| MACD (12,26,9): | 0.3800 | |
| Directional Movement: | 21.23 | |
| AROON (14): | 57.14 | |
| DEMA (21): | 25.16 | |
| Parabolic SAR (0,02-0,02-0,2): | 24.82 | |
| Elder Ray (13): | 0.37 | |
| Super Trend (3,10): | 24.42 | |
| Zig ZAG (10): | 25.21 | |
| VORTEX (21): | 1.1700 | |
| Stochastique (14,3,5): | 80.95 | |
| TEMA (21): | 25.35 | |
| Williams %R (14): | -22.86 | |
| Chande Momentum Oscillator (20): | 1.24 | |
| Repulse (5,40,3): | -0.4700 | |
| ROCnROLL: | 1 | |
| TRIX (15,9): | 0.1700 | |
| Courbe Coppock: | 9.74 |
| MA7: | 25.22 | |
| MA20: | 24.59 | |
| MA50: | 24.21 | |
| MA100: | 23.30 | |
| MAexp7: | 25.15 | |
| MAexp20: | 24.74 | |
| MAexp50: | 24.25 | |
| MAexp100: | 23.94 | |
| Price / MA7: | -0.16% | |
| Price / MA20: | +2.40% | |
| Price / MA50: | +4.01% | |
| Price / MA100: | +8.07% | |
| Price / MAexp7: | +0.12% | |
| Price / MAexp20: | +1.78% | |
| Price / MAexp50: | +3.84% | |
| Price / MAexp100: | +5.18% |
News
The latest news and videos published on OCEANFIRST FINANCIAL at the time of the analysis were as follows:
- OceanFirst Financial Corp. to Host Earnings Call
- SHAREHOLDER ALERT: WeissLaw LLP Investigates the Acquisition of Sun Bancorp, Inc.
-
 OceanFirst Financial
- OceanFirst Financial Corp. Announces Quarterly and Annual Financial Results
- OceanFirst Financial Corp. Schedules Earnings Conference Call
About author

Online


Add a comment
Comments
0 comments on the analysis OCEANFIRST FINANCIAL - Daily