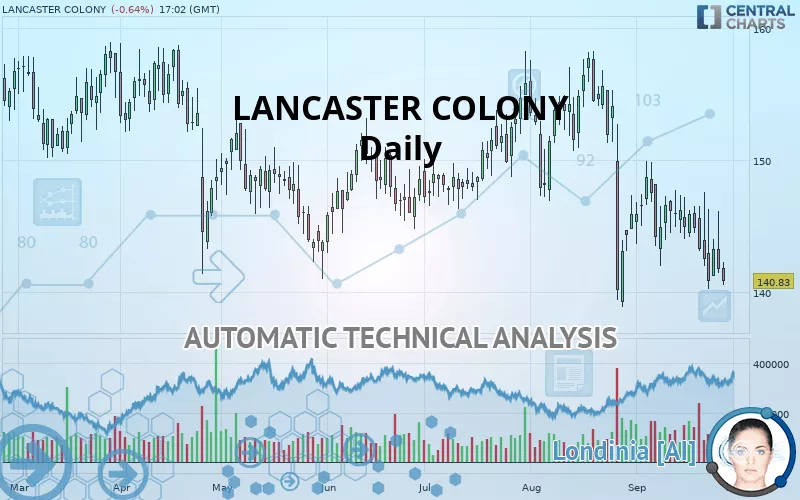
LANCASTER COLONY - Daily - Technical analysis published on 09/27/2019 (GMT)
- 234
- 0
- Who voted?
Click here for a new analysis!
- Timeframe : Daily
- - Analysis generated on
- Status : TARGET REACHED

Summary of the analysis

Additional analysis
Quotes
The LANCASTER COLONY price is 140.83 USD. The price registered a decrease of -0.64% on the session and was between 140.55 USD and 142.29 USD. This implies that the price is at +0.20% from its lowest and at -1.03% from its highest.A bullish opening was detected by the Central Gaps scanner. Buyers are trying to impose a bullish momentum in the very short term.
Bullish opening
Type : Bullish
Timeframe : Openning
Here is a more detailed summary of the historical variations registered by LANCASTER COLONY:
Near a new LOW record (1 year)
Type : Bearish
Timeframe : Weekly
Near a new LOW record (1st january)
Type : Bearish
Timeframe : Weekly
Near a new LOW record (1 month)
Type : Bearish
Timeframe : Weekly
Technical
A technical analysis in Daily of this LANCASTER COLONY chart shows a sharp bearish trend. 89.29% of the signals given by moving averages are bearish. The overall trend is supported by the strong bearish signals from short-term moving averages. The Central Indicators scanner does not detect any result on moving averages that would impact this trend.
An assessment of technical indicators shows a bearish signal.
Caution: the Central Indicators scanner currently detects an excess:
CCI indicator is oversold : under -100
Type : Neutral
Timeframe : Daily
Williams %R indicator is oversold : under -80
Type : Neutral
Timeframe : Daily
Pivot points : price is under support 1
Type : Neutral
Timeframe : Weekly
Price is back under the pivot point
Type : Bearish
Timeframe : Daily
Central Patterns, the market scanner focusing on chart patterns, resistances and supports found this result:
Support of channel is broken
Type : Bearish
Timeframe : Daily
Central Candlesticks, the scanner specialised in Japanese candlesticks, detects a bearish signal that could support the hypothesis of a small drop in the very short term:
Bearish harami
Type : Bearish
Timeframe : Daily
| S3 | S2 | S1 | Price | R1 | R2 | R3 | |
|---|---|---|---|---|---|---|---|
| ProTrendLines | 126.09 | 134.49 | 140.19 | 140.83 | 144.00 | 148.64 | 157.93 |
| Change (%) | -10.47% | -4.50% | -0.45% | - | +2.25% | +5.55% | +12.14% |
| Change | -14.74 | -6.34 | -0.64 | - | +3.17 | +7.81 | +17.10 |
| Level | Minor | Intermediate | Major | - | Major | Major | Major |
To determine price objectives, it is also possible to use the pivot points. Here is the price position in relation to pivot points:
| Pivot points | S3 | S2 | S1 | PP | R1 | R2 | R3 |
|---|---|---|---|---|---|---|---|
| Standard | 135.40 | 138.42 | 140.08 | 143.11 | 144.77 | 147.79 | 149.45 |
| Camarilla | 140.45 | 140.88 | 141.31 | 141.74 | 142.17 | 142.60 | 143.03 |
| Woodie | 134.71 | 138.08 | 139.40 | 142.77 | 144.08 | 147.45 | 148.77 |
| Fibonacci | 138.42 | 140.21 | 141.32 | 143.11 | 144.90 | 146.00 | 147.79 |
| Pivot points | S3 | S2 | S1 | PP | R1 | R2 | R3 |
|---|---|---|---|---|---|---|---|
| Standard | 137.51 | 140.31 | 141.80 | 144.60 | 146.08 | 148.88 | 150.37 |
| Camarilla | 142.10 | 142.49 | 142.89 | 143.28 | 143.67 | 144.07 | 144.46 |
| Woodie | 136.85 | 139.98 | 141.14 | 144.27 | 145.42 | 148.55 | 149.71 |
| Fibonacci | 140.31 | 141.95 | 142.96 | 144.60 | 146.23 | 147.24 | 148.88 |
| Pivot points | S3 | S2 | S1 | PP | R1 | R2 | R3 |
|---|---|---|---|---|---|---|---|
| Standard | 117.76 | 128.33 | 137.11 | 147.68 | 156.47 | 167.04 | 175.82 |
| Camarilla | 140.58 | 142.35 | 144.13 | 145.90 | 147.67 | 149.45 | 151.22 |
| Woodie | 116.87 | 127.88 | 136.22 | 147.24 | 155.58 | 166.59 | 174.93 |
| Fibonacci | 128.33 | 135.72 | 140.29 | 147.68 | 155.08 | 159.64 | 167.04 |
Numerical data
The following is the status of technical indicators and moving averages registered at the time this technical analysis was created:
| RSI (14): | 38.46 | |
| MACD (12,26,9): | -2.0500 | |
| Directional Movement: | -8.58 | |
| AROON (14): | -78.57 | |
| DEMA (21): | 142.18 | |
| Parabolic SAR (0,02-0,02-0,2): | 146.95 | |
| Elder Ray (13): | -2.23 | |
| Super Trend (3,10): | 152.20 | |
| Zig ZAG (10): | 140.99 | |
| VORTEX (21): | 1.0100 | |
| Stochastique (14,3,5): | 18.80 | |
| TEMA (21): | 141.09 | |
| Williams %R (14): | -94.52 | |
| Chande Momentum Oscillator (20): | -5.93 | |
| Repulse (5,40,3): | -4.6000 | |
| ROCnROLL: | 2 | |
| TRIX (15,9): | -0.1800 | |
| Courbe Coppock: | 4.86 |
| MA7: | 142.48 | |
| MA20: | 144.86 | |
| MA50: | 149.13 | |
| MA100: | 148.50 | |
| MAexp7: | 142.46 | |
| MAexp20: | 144.77 | |
| MAexp50: | 147.32 | |
| MAexp100: | 149.38 | |
| Price / MA7: | -1.16% | |
| Price / MA20: | -2.78% | |
| Price / MA50: | -5.57% | |
| Price / MA100: | -5.16% | |
| Price / MAexp7: | -1.14% | |
| Price / MAexp20: | -2.72% | |
| Price / MAexp50: | -4.41% | |
| Price / MAexp100: | -5.72% |
News
The last news published on LANCASTER COLONY at the time of the generation of this analysis was as follows:
- Lancaster Colony Reports Fourth Quarter and Fiscal Year Results
- Lancaster Colony Continues Higher Cash Dividend; Board of Directors Sets Annual Meeting Date and Time
- Lancaster Colony Corporation Names Kristin Bird Foodservice Division President
- Lancaster Colony To Webcast Fourth Quarter And Fiscal Year 2019 Conference Call
- Lancaster Colony To Present At Baird 2019 Global Consumer, Technology & Services Conference
About author

Online


Add a comment
Comments
0 comments on the analysis LANCASTER COLONY - Daily