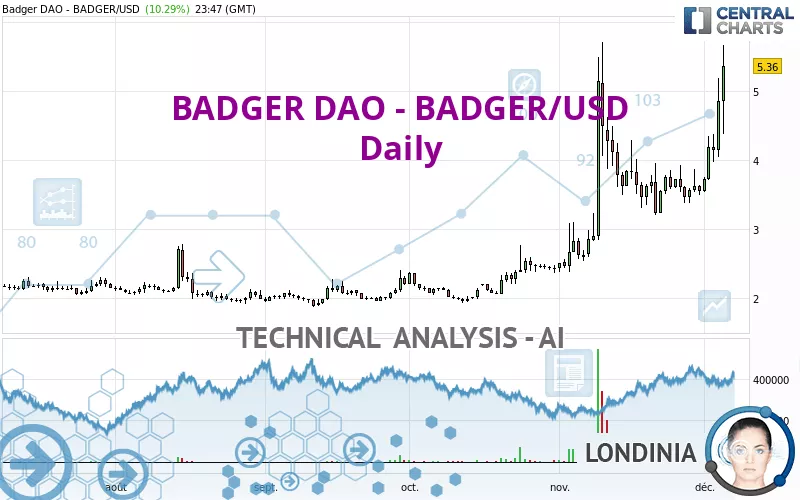
BADGER DAO - BADGER/USD - Daily - Technical analysis published on 12/05/2023 (GMT)
- 155
- 0
Click here for a new analysis!
- Timeframe : Daily
- - Analysis generated on
- Status : TARGET REACHED

Summary of the analysis

Additional analysis
Quotes
The BADGER DAO - BADGER/USD rating is 5.36 USD. The price registered an increase of +10.29% on the session and was between 4.38 USD and 5.67 USD. This implies that the price is at +22.37% from its lowest and at -5.47% from its highest.The Central Gaps scanner detects a bearish opening. A small advantage for sellers in the very short term.
Bearish opening
Type : Bearish
Timeframe : Openning
Here is a more detailed summary of the historical variations registered by BADGER DAO - BADGER/USD:
Near a new HIGH record (1 year)
Type : Bullish
Timeframe : Weekly
New HIGH record (1st january)
Type : Bullish
Timeframe : Weekly
Near a new HIGH record (1 month)
Type : Bullish
Timeframe : Weekly
The Central Volumes scanner notes the presence of abnormal volumes:
Abnormal volumes
Timeframe : 5 days
Abnormal volumes
Timeframe : 20 days
Abnormal volumes
Timeframe : 50 days
Technical
Technical analysis of BADGER DAO - BADGER/USD in Daily shows a strongly overall bullish trend. The signals given by the moving averages are 92.86% bullish. This strong bullish trend is confirmed by the strong signals currently being given by short-term moving averages. The Central Indicators scanner does not detect any result on moving averages that would impact this trend.
Technical indicators are strongly bullish, suggesting that the price increase should continue.
Caution: the Central Indicators scanner currently detects an excess:
RSI indicator is overbought : over 70
Type : Neutral
Timeframe : Daily
CCI indicator is overbought : over 100
Type : Neutral
Timeframe : Daily
Previous candle closed over Bollinger bands
Type : Neutral
Timeframe : Daily
Williams %R indicator is overbought : over -20
Type : Neutral
Timeframe : Daily
Pivot points : price is over resistance 2
Type : Neutral
Timeframe : Weekly
No signals are given by Central Patterns, a market scanner specialised in chart patterns, resistances and supports.
No result was found by the Central Candlesticks scanner on Japanese candlesticks.
| S3 | S2 | S1 | Price | R1 | R2 | |
|---|---|---|---|---|---|---|
| ProTrendLines | 3.23 | 3.87 | 5.28 | 5.36 | 6.81 | 12.64 |
| Change (%) | -39.74% | -27.80% | -1.49% | - | +27.05% | +135.82% |
| Change | -2.13 | -1.49 | -0.08 | - | +1.45 | +7.28 |
| Level | Minor | Major | Major | - | Minor | Major |
Attention could also be paid to pivot points to set price objectives:
| Pivot points | S3 | S2 | S1 | PP | R1 | R2 | R3 |
|---|---|---|---|---|---|---|---|
| Standard | 3.05 | 3.55 | 4.20 | 4.70 | 5.35 | 5.85 | 6.50 |
| Camarilla | 4.54 | 4.65 | 4.76 | 4.86 | 4.97 | 5.07 | 5.18 |
| Woodie | 3.14 | 3.59 | 4.29 | 4.74 | 5.44 | 5.89 | 6.59 |
| Fibonacci | 3.55 | 3.99 | 4.26 | 4.70 | 5.14 | 5.41 | 5.85 |
| Pivot points | S3 | S2 | S1 | PP | R1 | R2 | R3 |
|---|---|---|---|---|---|---|---|
| Standard | 2.61 | 2.99 | 3.59 | 3.97 | 4.57 | 4.95 | 5.55 |
| Camarilla | 3.92 | 4.01 | 4.10 | 4.19 | 4.28 | 4.37 | 4.46 |
| Woodie | 2.72 | 3.05 | 3.70 | 4.03 | 4.68 | 5.01 | 5.66 |
| Fibonacci | 2.99 | 3.36 | 3.60 | 3.97 | 4.34 | 4.58 | 4.95 |
| Pivot points | S3 | S2 | S1 | PP | R1 | R2 | R3 |
|---|---|---|---|---|---|---|---|
| Standard | -1.30 | 0.54 | 2.04 | 3.88 | 5.38 | 7.22 | 8.72 |
| Camarilla | 2.63 | 2.94 | 3.24 | 3.55 | 3.86 | 4.16 | 4.47 |
| Woodie | -1.46 | 0.46 | 1.88 | 3.80 | 5.22 | 7.14 | 8.56 |
| Fibonacci | 0.54 | 1.81 | 2.60 | 3.88 | 5.15 | 5.94 | 7.22 |
Numerical data
The following is the status of the technical indicators and moving averages at the time of publication of this technical analysis:
| RSI (14): | 74.38 | |
| MACD (12,26,9): | 0.3600 | |
| Directional Movement: | 34.86 | |
| AROON (14): | 100.00 | |
| DEMA (21): | 4.35 | |
| Parabolic SAR (0,02-0,02-0,2): | 3.39 | |
| Elder Ray (13): | 0.92 | |
| Super Trend (3,10): | 3.42 | |
| Zig ZAG (10): | 5.30 | |
| VORTEX (21): | 1.1000 | |
| Stochastique (14,3,5): | 82.57 | |
| TEMA (21): | 4.46 | |
| Williams %R (14): | -15.94 | |
| Chande Momentum Oscillator (20): | 1.53 | |
| Repulse (5,40,3): | 26.5900 | |
| ROCnROLL: | 1 | |
| TRIX (15,9): | 0.9500 | |
| Courbe Coppock: | 39.65 |
| MA7: | 4.20 | |
| MA20: | 3.81 | |
| MA50: | 3.24 | |
| MA100: | 2.65 | |
| MAexp7: | 4.42 | |
| MAexp20: | 3.92 | |
| MAexp50: | 3.39 | |
| MAexp100: | 2.95 | |
| Price / MA7: | +27.62% | |
| Price / MA20: | +40.68% | |
| Price / MA50: | +65.43% | |
| Price / MA100: | +102.26% | |
| Price / MAexp7: | +21.27% | |
| Price / MAexp20: | +36.73% | |
| Price / MAexp50: | +58.11% | |
| Price / MAexp100: | +81.69% |
About author

Online


Add a comment
Comments
0 comments on the analysis BADGER DAO - BADGER/USD - Daily