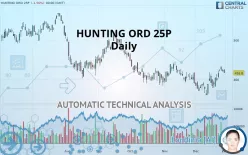
HUNTING ORD 25P - Daily - Technical analysis published on 01/02/2020 (GMT)
- 278
- 0
- Who voted?
Click here for a new analysis!
- Timeframe : Daily
- - Analysis generated on
- Status : INVALID

Summary of the analysis

Additional analysis
Quotes
The HUNTING ORD 25P rating is 416.8 GBX. On the day, this instrument lost -1.56% and was traded between 416.8 GBX and 426.0 GBX over the period. The price is currently at 0% from its lowest and -2.16% from its highest.The Central Gaps scanner detects a bearish gap which is a sign that the sellers have taken the lead in the very short term.
Opening Gap DOWN
Type : Bearish
Timeframe : Openning
So that you have an overall view of the price change, here is a table showing the variations over several periods:
Near a new HIGH record (1 month)
Type : Bullish
Timeframe : Weekly
Technical
Technical analysis of HUNTING ORD 25P in Daily shows a neutral overall trend. The strong bullish signals currently being given by short-term moving averages could allow the overall trend to return to bullish. An assessment of moving averages reveals a bullish signal that could impact this trend:
Bullish price crossover with adaptative moving average 100
Type : Bullish
Timeframe : Daily
Technical indicators are strongly bullish, suggesting that the price increase should continue.
Caution: the Central Indicators scanner currently detects an excess:
CCI indicator is overbought : over 100
Type : Neutral
Timeframe : Daily
Williams %R indicator is overbought : over -20
Type : Neutral
Timeframe : Daily
Pivot points : price is over resistance 1
Type : Neutral
Timeframe : Weekly
Ichimoku - Bullish crossover : Tenkan & Kijun
Type : Bullish
Timeframe : Daily
Price is back under the pivot point
Type : Bearish
Timeframe : Daily
The Central Patterns scanner, which studies chart patterns, resistances and supports, has identified these signals:
Near resistance of channel
Type : Bearish
Timeframe : Daily
Near horizontal support
Type : Bullish
Timeframe : Daily
No result was found by the Central Candlesticks scanner on Japanese candlesticks.
| S3 | S2 | S1 | Price | R1 | R2 | R3 | |
|---|---|---|---|---|---|---|---|
| ProTrendLines | 328.2 | 382.9 | 413.9 | 416.8 | 453.6 | 530.0 | 565.0 |
| Change (%) | -21.26% | -8.13% | -0.70% | - | +8.83% | +27.16% | +35.56% |
| Change | -88.6 | -33.9 | -2.9 | - | +36.8 | +113.2 | +148.2 |
| Level | Major | Major | Major | - | Intermediate | Intermediate | Intermediate |
To determine price objectives, it is also possible to use the pivot points. Here is the price position in relation to pivot points:
| Pivot points | S3 | S2 | S1 | PP | R1 | R2 | R3 |
|---|---|---|---|---|---|---|---|
| Standard | 409.1 | 415.3 | 420.1 | 426.3 | 431.1 | 437.3 | 442.1 |
| Camarilla | 422.0 | 423.0 | 424.0 | 425.0 | 426.0 | 427.0 | 428.0 |
| Woodie | 408.5 | 415.0 | 419.5 | 426.0 | 430.5 | 437.0 | 441.5 |
| Fibonacci | 415.3 | 419.5 | 422.1 | 426.3 | 430.5 | 433.1 | 437.3 |
| Pivot points | S3 | S2 | S1 | PP | R1 | R2 | R3 |
|---|---|---|---|---|---|---|---|
| Standard | 348.5 | 363.5 | 383.5 | 398.5 | 418.5 | 433.5 | 453.5 |
| Camarilla | 394.0 | 397.2 | 400.4 | 403.6 | 406.8 | 410.0 | 413.2 |
| Woodie | 351.1 | 364.8 | 386.1 | 399.8 | 421.1 | 434.8 | 456.1 |
| Fibonacci | 363.5 | 376.8 | 385.1 | 398.5 | 411.8 | 420.1 | 433.5 |
| Pivot points | S3 | S2 | S1 | PP | R1 | R2 | R3 |
|---|---|---|---|---|---|---|---|
| Standard | 315.5 | 352.3 | 371.3 | 408.1 | 427.1 | 463.9 | 482.9 |
| Camarilla | 375.1 | 380.2 | 385.3 | 390.4 | 395.5 | 400.6 | 405.7 |
| Woodie | 306.7 | 347.9 | 362.5 | 403.7 | 418.3 | 459.5 | 474.1 |
| Fibonacci | 352.3 | 373.6 | 386.8 | 408.1 | 429.4 | 442.6 | 463.9 |
Numerical data
The following are the details of the technical indicators and moving averages that were collected to generate this technical analysis:
| RSI (14): | 59.10 | |
| MACD (12,26,9): | 3.8000 | |
| Directional Movement: | 7.9 | |
| AROON (14): | 64.3 | |
| DEMA (21): | 406.1 | |
| Parabolic SAR (0,02-0,02-0,2): | 376.4 | |
| Elder Ray (13): | 16.8 | |
| Super Trend (3,10): | 373.7 | |
| Zig ZAG (10): | 423.4 | |
| VORTEX (21): | 1.0000 | |
| Stochastique (14,3,5): | 90.30 | |
| TEMA (21): | 415.5 | |
| Williams %R (14): | -12.50 | |
| Chande Momentum Oscillator (20): | 46.4 | |
| Repulse (5,40,3): | 0.8000 | |
| ROCnROLL: | 1 | |
| TRIX (15,9): | -0.1000 | |
| Courbe Coppock: | 16.10 |
| MA7: | 411.8 | |
| MA20: | 394.5 | |
| MA50: | 406.4 | |
| MA100: | 427.9 | |
| MAexp7: | 414.0 | |
| MAexp20: | 404.1 | |
| MAexp50: | 410.5 | |
| MAexp100: | 431.9 | |
| Price / MA7: | +1.21% | |
| Price / MA20: | +5.65% | |
| Price / MA50: | +2.56% | |
| Price / MA100: | -2.59% | |
| Price / MAexp7: | +0.68% | |
| Price / MAexp20: | +3.14% | |
| Price / MAexp50: | +1.53% | |
| Price / MAexp100: | -3.50% |
About author

Online


Add a comment
Comments
0 comments on the analysis HUNTING ORD 25P - Daily