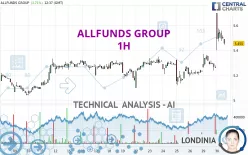
ALLFUNDS GROUP - 1H - Technical analysis published on 07/30/2024 (GMT)
- 183
- 0
Click here for a new analysis!
- Timeframe : 1H
- - Analysis generated on
- Status : LEVEL MAINTAINED

Summary of the analysis

Additional analysis
Quotes
The ALLFUNDS GROUP rating is 5.470 EUR. The price registered an increase of +3.99% on the session and was between 5.400 EUR and 5.700 EUR. This implies that the price is at +1.30% from its lowest and at -4.04% from its highest.A bullish gap was detected at the opening by the Central Gaps scanner. There are a lot of buyers and they have the upper hand in the very short term.
Opening Gap UP
Type : Bullish
Timeframe : Openning
A study of price movements over other periods shows the following variations:
New HIGH record (1 month)
Type : Bullish
Timeframe : Weekly
Technical
A technical analysis in 1H of this ALLFUNDS GROUP chart shows a strongly bullish trend. 92.86% of the signals given by moving averages are bullish. The overall trend is supported by the strong bullish signals from short-term moving averages. The Central Indicators market scanner currently does not detect any result that concerns moving averages.
In fact, according to the parameters integrated into the Central Analyzer system, 12 technical indicators out of 18 analysed are currently bullish. Other results related to technical indicators were also found by the Central Indicators scanner:
Pivot points : price is over resistance 1
Type : Neutral
Timeframe : Weekly
Pivot points : price is over resistance 3
Type : Neutral
Timeframe : 1 hour
Williams %R indicator is back under -50
Type : Bearish
Timeframe : 1 hour
Central Patterns, the market scanner focusing on chart patterns, resistances and supports found these results:
Near horizontal resistance
Type : Bearish
Timeframe : 1 hour
Resistance of channel is broken
Type : Bullish
Timeframe : 1 hour
For a small setback in the very short term, the Central Candlesticks scanner currently notes the presence of this bearish pattern in Japanese candlesticks:
Downside gap
Type : Bearish
Timeframe : 1 hour
| S3 | S2 | S1 | Price | R1 | R2 | R3 | |
|---|---|---|---|---|---|---|---|
| ProTrendLines | 5.269 | 5.318 | 5.370 | 5.470 | 5.697 | 6.408 | 6.911 |
| Change (%) | -3.67% | -2.78% | -1.83% | - | +4.15% | +17.15% | +26.34% |
| Change | -0.201 | -0.152 | -0.100 | - | +0.227 | +0.938 | +1.441 |
| Level | Intermediate | Intermediate | Intermediate | - | Intermediate | Minor | Intermediate |
Pivot points can also be used to set your price objectives. Here is the price situation in relation to pivot points:
| Pivot points | S3 | S2 | S1 | PP | R1 | R2 | R3 |
|---|---|---|---|---|---|---|---|
| Standard | 5.080 | 5.160 | 5.210 | 5.290 | 5.340 | 5.420 | 5.470 |
| Camarilla | 5.224 | 5.236 | 5.248 | 5.260 | 5.272 | 5.284 | 5.296 |
| Woodie | 5.065 | 5.153 | 5.195 | 5.283 | 5.325 | 5.413 | 5.455 |
| Fibonacci | 5.160 | 5.210 | 5.240 | 5.290 | 5.340 | 5.370 | 5.420 |
| Pivot points | S3 | S2 | S1 | PP | R1 | R2 | R3 |
|---|---|---|---|---|---|---|---|
| Standard | 4.857 | 4.978 | 5.107 | 5.228 | 5.357 | 5.478 | 5.607 |
| Camarilla | 5.166 | 5.189 | 5.212 | 5.235 | 5.258 | 5.281 | 5.304 |
| Woodie | 4.860 | 4.980 | 5.110 | 5.230 | 5.360 | 5.480 | 5.610 |
| Fibonacci | 4.978 | 5.074 | 5.133 | 5.228 | 5.324 | 5.383 | 5.478 |
| Pivot points | S3 | S2 | S1 | PP | R1 | R2 | R3 |
|---|---|---|---|---|---|---|---|
| Standard | 4.383 | 4.757 | 4.998 | 5.372 | 5.613 | 5.987 | 6.228 |
| Camarilla | 5.071 | 5.127 | 5.184 | 5.240 | 5.296 | 5.353 | 5.409 |
| Woodie | 4.318 | 4.724 | 4.933 | 5.339 | 5.548 | 5.954 | 6.163 |
| Fibonacci | 4.757 | 4.992 | 5.137 | 5.372 | 5.607 | 5.752 | 5.987 |
Numerical data
The following is the status of technical indicators and moving averages registered at the time this technical analysis was created:
| RSI (14): | 64.69 | |
| MACD (12,26,9): | 0.0650 | |
| Directional Movement: | 25.454 | |
| AROON (14): | 14.286 | |
| DEMA (21): | 5.449 | |
| Parabolic SAR (0,02-0,02-0,2): | 5.261 | |
| Elder Ray (13): | 0.056 | |
| Super Trend (3,10): | 5.315 | |
| Zig ZAG (10): | 5.470 | |
| VORTEX (21): | 1.0530 | |
| Stochastique (14,3,5): | 53.94 | |
| TEMA (21): | 5.499 | |
| Williams %R (14): | -50.00 | |
| Chande Momentum Oscillator (20): | 0.120 | |
| Repulse (5,40,3): | -1.3270 | |
| ROCnROLL: | 1 | |
| TRIX (15,9): | 0.1190 | |
| Courbe Coppock: | 7.44 |
| MA7: | 5.295 | |
| MA20: | 5.238 | |
| MA50: | 5.358 | |
| MA100: | 5.849 | |
| MAexp7: | 5.458 | |
| MAexp20: | 5.375 | |
| MAexp50: | 5.313 | |
| MAexp100: | 5.283 | |
| Price / MA7: | +3.31% | |
| Price / MA20: | +4.43% | |
| Price / MA50: | +2.09% | |
| Price / MA100: | -6.48% | |
| Price / MAexp7: | +0.22% | |
| Price / MAexp20: | +1.77% | |
| Price / MAexp50: | +2.96% | |
| Price / MAexp100: | +3.54% |
About author
Online


Add a comment
Comments
0 comments on the analysis ALLFUNDS GROUP - 1H