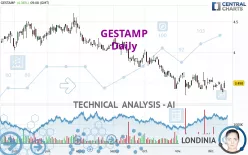
GESTAMP - Daily - Technical analysis published on 12/14/2023 (GMT)
- 162
- 0
Click here for a new analysis!
- Timeframe : Daily
- - Analysis generated on
- Status : TARGET REACHED

Summary of the analysis

Additional analysis
Quotes
The GESTAMP rating is 3.498 EUR. The price has increased by +4.36% since the last closing and was between 3.416 EUR and 3.538 EUR. This implies that the price is at +2.40% from its lowest and at -1.13% from its highest.A bullish opening was detected by the Central Gaps scanner. Buyers are trying to impose a bullish momentum in the very short term.
Bullish opening
Type : Bullish
Timeframe : Openning
So that you have an overall view of the price change, here is a table showing the variations over several periods:
Near a new LOW record (1 year)
Type : Bearish
Timeframe : Weekly
Near a new LOW record (1st january)
Type : Bearish
Timeframe : Weekly
Near a new LOW record (1 month)
Type : Bearish
Timeframe : Weekly
Technical
A technical analysis in Daily of this GESTAMP chart shows a bearish trend. 75.00% of the signals given by moving averages are bearish. Caution: the neutral signals currently given by short-term moving averages show us that the global trend is losing momentum. An assessment of moving averages reveals a bullish signal that could impact this trend:
Bullish price crossover with Moving Average 20
Type : Bullish
Timeframe : Daily
Technical indicators are slightly bullish. There is therefore considerable uncertainty about the continuation of the increase.
But beware of excesses. The Central Indicators scanner currently detects this:
Previous candle closed under Bollinger bands
Type : Neutral
Timeframe : Daily
Pivot points : price is over resistance 3
Type : Neutral
Timeframe : Daily
RSI indicator is back over 50
Type : Bullish
Timeframe : Daily
MACD crosses UP its Moving Average
Type : Bullish
Timeframe : Daily
Momentum indicator is back over 0
Type : Bullish
Timeframe : Daily
Williams %R indicator is back over -50
Type : Bullish
Timeframe : Daily
An analysis of the price chart with the Central Patterns scanner (detector of chart patterns and resistances and supports) shows a result that can have an impact on the price change:
Near resistance of channel
Type : Bearish
Timeframe : Daily
The Central Candlesticks scanner, specialised in Japanese candlesticks, did not identify any signals.
| S3 | S2 | S1 | Price | R1 | R2 | R3 | |
|---|---|---|---|---|---|---|---|
| ProTrendLines | 2.242 | 2.697 | 3.400 | 3.498 | 3.774 | 4.134 | 4.424 |
| Change (%) | -35.91% | -22.90% | -2.80% | - | +7.89% | +18.18% | +26.47% |
| Change | -1.256 | -0.801 | -0.098 | - | +0.276 | +0.636 | +0.926 |
| Level | Minor | Major | Major | - | Intermediate | Minor | Intermediate |
Pivot points can also be used to set your price objectives. Here is the price situation in relation to pivot points:
| Pivot points | S3 | S2 | S1 | PP | R1 | R2 | R3 |
|---|---|---|---|---|---|---|---|
| Standard | 3.251 | 3.301 | 3.327 | 3.377 | 3.403 | 3.453 | 3.479 |
| Camarilla | 3.331 | 3.338 | 3.345 | 3.352 | 3.359 | 3.366 | 3.373 |
| Woodie | 3.238 | 3.295 | 3.314 | 3.371 | 3.390 | 3.447 | 3.466 |
| Fibonacci | 3.301 | 3.330 | 3.348 | 3.377 | 3.406 | 3.424 | 3.453 |
| Pivot points | S3 | S2 | S1 | PP | R1 | R2 | R3 |
|---|---|---|---|---|---|---|---|
| Standard | 3.183 | 3.281 | 3.391 | 3.489 | 3.599 | 3.697 | 3.807 |
| Camarilla | 3.443 | 3.462 | 3.481 | 3.500 | 3.519 | 3.538 | 3.557 |
| Woodie | 3.188 | 3.284 | 3.396 | 3.492 | 3.604 | 3.700 | 3.812 |
| Fibonacci | 3.281 | 3.361 | 3.410 | 3.489 | 3.569 | 3.618 | 3.697 |
| Pivot points | S3 | S2 | S1 | PP | R1 | R2 | R3 |
|---|---|---|---|---|---|---|---|
| Standard | 2.940 | 3.120 | 3.320 | 3.500 | 3.700 | 3.880 | 4.080 |
| Camarilla | 3.416 | 3.450 | 3.485 | 3.520 | 3.555 | 3.590 | 3.625 |
| Woodie | 2.950 | 3.125 | 3.330 | 3.505 | 3.710 | 3.885 | 4.090 |
| Fibonacci | 3.120 | 3.265 | 3.355 | 3.500 | 3.645 | 3.735 | 3.880 |
Numerical data
The following are the details of the technical indicators and moving averages that were collected to generate this technical analysis:
| RSI (14): | 50.18 | |
| MACD (12,26,9): | -0.0370 | |
| Directional Movement: | 0.395 | |
| AROON (14): | -92.857 | |
| DEMA (21): | 3.427 | |
| Parabolic SAR (0,02-0,02-0,2): | 3.634 | |
| Elder Ray (13): | 0.014 | |
| Super Trend (3,10): | 3.651 | |
| Zig ZAG (10): | 3.504 | |
| VORTEX (21): | 0.8650 | |
| Stochastique (14,3,5): | 22.36 | |
| TEMA (21): | 3.446 | |
| Williams %R (14): | -35.59 | |
| Chande Momentum Oscillator (20): | 0.092 | |
| Repulse (5,40,3): | -0.6750 | |
| ROCnROLL: | -1 | |
| TRIX (15,9): | -0.1560 | |
| Courbe Coppock: | 2.08 |
| MA7: | 3.450 | |
| MA20: | 3.477 | |
| MA50: | 3.576 | |
| MA100: | 3.819 | |
| MAexp7: | 3.449 | |
| MAexp20: | 3.480 | |
| MAexp50: | 3.588 | |
| MAexp100: | 3.739 | |
| Price / MA7: | +1.39% | |
| Price / MA20: | +0.60% | |
| Price / MA50: | -2.18% | |
| Price / MA100: | -8.41% | |
| Price / MAexp7: | +1.42% | |
| Price / MAexp20: | +0.52% | |
| Price / MAexp50: | -2.51% | |
| Price / MAexp100: | -6.45% |
About author
Online


Add a comment
Comments
0 comments on the analysis GESTAMP - Daily