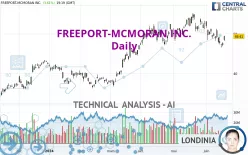
FREEPORT-MCMORAN INC. - Daily - Technical analysis published on 06/20/2024 (GMT)
- 145
- 0
Click here for a new analysis!
- Timeframe : Daily
- - Analysis generated on
- Status : INVALID

Summary of the analysis

Additional analysis
Quotes
The FREEPORT-MCMORAN INC. rating is 49.41 USD. On the day, this instrument gained +3.61% with the lowest point at 48.22 USD and the highest point at 49.54 USD. The deviation from the price is +2.47% for the low point and -0.26% for the high point.A bullish gap was detected at the opening by the Central Gaps scanner. There are a lot of buyers and they have the upper hand in the very short term.
Opening Gap UP
Type : Bullish
Timeframe : Openning
So that you have an overall view of the price change, here is a table showing the variations over several periods:
Near a new LOW record (1 month)
Type : Bearish
Timeframe : Weekly
Technical
Technical analysis of FREEPORT-MCMORAN INC. in Daily shows a neutral overall trend. The trend could quickly turn bearish due to the strong bearish signals currently being given by short-term moving averages. An assessment of moving averages reveals a bullish signal that could impact this trend:
Bullish price crossover with adaptative moving average 100
Type : Bullish
Timeframe : Daily
On the 18 technical indicators analysed, 7 are bullish, 6 are neutral and 5 are bearish. Central Indicators, the scanner specialised in technical indicators, has identified these signals:
Pivot points : price is over resistance 3
Type : Neutral
Timeframe : Daily
Price is back over the pivot point
Type : Bullish
Timeframe : Weekly
The Central Patterns scanner, which studies chart patterns, resistances and supports, has identified this signal:
Horizontal resistance is broken
Type : Bullish
Timeframe : Daily
The presence of a bullish Japanese candlestick pattern detected by Central Candlesticks that could cause a very short term rebound was also detected:
Upside gap
Type : Bullish
Timeframe : Daily
| S3 | S2 | S1 | Price | R1 | R2 | |
|---|---|---|---|---|---|---|
| ProTrendLines | 40.17 | 44.49 | 47.99 | 49.41 | 50.67 | 54.86 |
| Change (%) | -18.70% | -9.96% | -2.87% | - | +2.55% | +11.03% |
| Change | -9.24 | -4.92 | -1.42 | - | +1.26 | +5.45 |
| Level | Minor | Major | Major | - | Major | Major |
To determine price objectives, it is also possible to use the pivot points. Here is the price position in relation to pivot points:
| Pivot points | S3 | S2 | S1 | PP | R1 | R2 | R3 |
|---|---|---|---|---|---|---|---|
| Standard | 46.03 | 46.46 | 47.07 | 47.50 | 48.11 | 48.54 | 49.15 |
| Camarilla | 47.40 | 47.50 | 47.60 | 47.69 | 47.79 | 47.88 | 47.98 |
| Woodie | 46.13 | 46.51 | 47.17 | 47.55 | 48.21 | 48.59 | 49.25 |
| Fibonacci | 46.46 | 46.85 | 47.10 | 47.50 | 47.89 | 48.14 | 48.54 |
| Pivot points | S3 | S2 | S1 | PP | R1 | R2 | R3 |
|---|---|---|---|---|---|---|---|
| Standard | 42.68 | 45.03 | 46.57 | 48.92 | 50.46 | 52.81 | 54.35 |
| Camarilla | 47.04 | 47.40 | 47.75 | 48.11 | 48.47 | 48.82 | 49.18 |
| Woodie | 42.28 | 44.83 | 46.17 | 48.72 | 50.06 | 52.61 | 53.95 |
| Fibonacci | 45.03 | 46.52 | 47.43 | 48.92 | 50.41 | 51.32 | 52.81 |
| Pivot points | S3 | S2 | S1 | PP | R1 | R2 | R3 |
|---|---|---|---|---|---|---|---|
| Standard | 41.87 | 45.04 | 48.89 | 52.06 | 55.91 | 59.08 | 62.93 |
| Camarilla | 50.80 | 51.44 | 52.09 | 52.73 | 53.37 | 54.02 | 54.66 |
| Woodie | 42.20 | 45.21 | 49.22 | 52.23 | 56.24 | 59.25 | 63.26 |
| Fibonacci | 45.04 | 47.73 | 49.38 | 52.06 | 54.75 | 56.40 | 59.08 |
Numerical data
The following are the details of the technical indicators and moving averages that were collected to generate this technical analysis:
| RSI (14): | 47.16 | |
| MACD (12,26,9): | -0.8000 | |
| Directional Movement: | -0.21 | |
| AROON (14): | -78.57 | |
| DEMA (21): | 49.01 | |
| Parabolic SAR (0,02-0,02-0,2): | 50.12 | |
| Elder Ray (13): | -0.44 | |
| Super Trend (3,10): | 52.30 | |
| Zig ZAG (10): | 49.33 | |
| VORTEX (21): | 0.7400 | |
| Stochastique (14,3,5): | 22.74 | |
| TEMA (21): | 47.79 | |
| Williams %R (14): | -59.08 | |
| Chande Momentum Oscillator (20): | -2.72 | |
| Repulse (5,40,3): | 2.7800 | |
| ROCnROLL: | 1 | |
| TRIX (15,9): | -0.1300 | |
| Courbe Coppock: | 14.18 |
| MA7: | 48.42 | |
| MA20: | 50.36 | |
| MA50: | 50.67 | |
| MA100: | 46.16 | |
| MAexp7: | 48.67 | |
| MAexp20: | 49.83 | |
| MAexp50: | 49.51 | |
| MAexp100: | 47.22 | |
| Price / MA7: | +2.04% | |
| Price / MA20: | -1.89% | |
| Price / MA50: | -2.49% | |
| Price / MA100: | +7.04% | |
| Price / MAexp7: | +1.52% | |
| Price / MAexp20: | -0.84% | |
| Price / MAexp50: | -0.20% | |
| Price / MAexp100: | +4.64% |
News
The last news published on FREEPORT-MCMORAN INC. at the time of the generation of this analysis was as follows:
- Freeport-McMoRan Investigating Cybersecurity Incident
- Freeport-McMoRan Second-Quarter 2023 Financial and Operating Results Release Available on Its Website
- Freeport-McMoRan Declares Quarterly Cash Dividends on Common Stock
- Freeport-McMoRan First-Quarter 2023 Financial and Operating Results Release Available on Its Website
- Freeport-McMoRan Publishes 2022 Annual Report on Sustainability
About author
Online


Add a comment
Comments
0 comments on the analysis FREEPORT-MCMORAN INC. - Daily