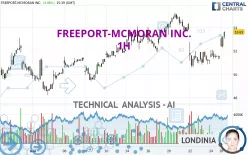
FREEPORT-MCMORAN INC. - 1H - Technical analysis published on 05/28/2024 (GMT)
- 131
- 0
Click here for a new analysis!
- Timeframe : 1H
- - Analysis generated on
- Status : INVALID

Summary of the analysis

Additional analysis
Quotes
FREEPORT-MCMORAN INC. rating 53.57 USD. The price has increased by +3.96% since the last closing and was traded between 52.28 USD and 53.60 USD over the period. The price is currently at +2.47% from its lowest and -0.06% from its highest.The Central Gaps scanner detects the formation of a bullish gap marking the strong presence of buyers against sellers at the opening. This formed a quotation gap.
Opening Gap UP
Type : Bullish
Timeframe : Openning
So that you have an overall view of the price change, here is a table showing the variations over several periods:
Near a new HIGH record (5 years)
Type : Bullish
Timeframe : Weekly
Near a new HIGH record (1 year)
Type : Bullish
Timeframe : Weekly
Near a new HIGH record (1st january)
Type : Bullish
Timeframe : Weekly
Near a new HIGH record (1 month)
Type : Bullish
Timeframe : Weekly
Technical
Technical analysis of FREEPORT-MCMORAN INC. in 1H shows an overall bullish trend. 78.57% of the signals given by moving averages are bullish. This bullish trend is supported by the strong bullish signals given by short-term moving averages. An assessment of moving averages reveals a bullish signal that could impact this trend:
Bullish trend reversal : Moving Average 50
Type : Bullish
Timeframe : 1 hour
In fact, 14 technical indicators on 18 studied are currently bullish. Caution: the Central Indicators scanner currently detects an excess:
CCI indicator is overbought : over 100
Type : Neutral
Timeframe : 1 hour
Previous candle closed over Bollinger bands
Type : Neutral
Timeframe : 1 hour
Williams %R indicator is overbought : over -20
Type : Neutral
Timeframe : 1 hour
Pivot points : price is over resistance 3
Type : Neutral
Timeframe : 1 hour
MACD indicator is back over 0
Type : Bullish
Timeframe : 1 hour
An analysis of the price chart with the Central Patterns scanner (detector of chart patterns and resistances and supports) shows several results that can have an impact on the price change:
Near horizontal resistance
Type : Bearish
Timeframe : 1 hour
Resistance of channel is broken
Type : Bullish
Timeframe : 1 hour
No result was found by the Central Candlesticks scanner on Japanese candlesticks.
| S3 | S2 | S1 | Price | R1 | R2 | |
|---|---|---|---|---|---|---|
| ProTrendLines | 51.46 | 52.41 | 53.13 | 53.57 | 54.08 | 54.86 |
| Change (%) | -3.94% | -2.17% | -0.82% | - | +0.95% | +2.41% |
| Change | -2.11 | -1.16 | -0.44 | - | +0.51 | +1.29 |
| Level | Major | Major | Intermediate | - | Minor | Intermediate |
To determine price objectives, it is also possible to use the pivot points. Here is the price position in relation to pivot points:
| Pivot points | S3 | S2 | S1 | PP | R1 | R2 | R3 |
|---|---|---|---|---|---|---|---|
| Standard | 50.38 | 50.83 | 51.18 | 51.63 | 51.98 | 52.43 | 52.78 |
| Camarilla | 51.31 | 51.38 | 51.46 | 51.53 | 51.60 | 51.68 | 51.75 |
| Woodie | 50.33 | 50.81 | 51.13 | 51.61 | 51.93 | 52.41 | 52.73 |
| Fibonacci | 50.83 | 51.14 | 51.32 | 51.63 | 51.94 | 52.12 | 52.43 |
| Pivot points | S3 | S2 | S1 | PP | R1 | R2 | R3 |
|---|---|---|---|---|---|---|---|
| Standard | 45.03 | 47.82 | 49.67 | 52.46 | 54.31 | 57.10 | 58.95 |
| Camarilla | 50.25 | 50.68 | 51.11 | 51.53 | 51.96 | 52.38 | 52.81 |
| Woodie | 44.57 | 47.59 | 49.21 | 52.23 | 53.85 | 56.87 | 58.49 |
| Fibonacci | 47.82 | 49.59 | 50.68 | 52.46 | 54.23 | 55.32 | 57.10 |
| Pivot points | S3 | S2 | S1 | PP | R1 | R2 | R3 |
|---|---|---|---|---|---|---|---|
| Standard | 41.77 | 44.43 | 47.19 | 49.85 | 52.61 | 55.27 | 58.03 |
| Camarilla | 48.45 | 48.95 | 49.44 | 49.94 | 50.44 | 50.93 | 51.43 |
| Woodie | 41.81 | 44.46 | 47.23 | 49.88 | 52.65 | 55.30 | 58.07 |
| Fibonacci | 44.43 | 46.50 | 47.78 | 49.85 | 51.92 | 53.20 | 55.27 |
Numerical data
The following are the details of the technical indicators and moving averages that were collected to generate this technical analysis:
| RSI (14): | 65.04 | |
| MACD (12,26,9): | 0.0000 | |
| Directional Movement: | 14.41 | |
| AROON (14): | 78.57 | |
| DEMA (21): | 51.95 | |
| Parabolic SAR (0,02-0,02-0,2): | 51.55 | |
| Elder Ray (13): | 1.18 | |
| Super Trend (3,10): | 51.37 | |
| Zig ZAG (10): | 53.46 | |
| VORTEX (21): | 1.1100 | |
| Stochastique (14,3,5): | 86.15 | |
| TEMA (21): | 52.25 | |
| Williams %R (14): | -2.20 | |
| Chande Momentum Oscillator (20): | 2.29 | |
| Repulse (5,40,3): | 1.5800 | |
| ROCnROLL: | 1 | |
| TRIX (15,9): | -0.1000 | |
| Courbe Coppock: | 3.71 |
| MA7: | 52.98 | |
| MA20: | 51.81 | |
| MA50: | 49.74 | |
| MA100: | 44.54 | |
| MAexp7: | 52.46 | |
| MAexp20: | 52.11 | |
| MAexp50: | 52.33 | |
| MAexp100: | 52.11 | |
| Price / MA7: | +1.11% | |
| Price / MA20: | +3.40% | |
| Price / MA50: | +7.70% | |
| Price / MA100: | +20.27% | |
| Price / MAexp7: | +2.12% | |
| Price / MAexp20: | +2.80% | |
| Price / MAexp50: | +2.37% | |
| Price / MAexp100: | +2.80% |
News
The latest news and videos published on FREEPORT-MCMORAN INC. at the time of the analysis were as follows:
- Freeport-McMoRan Investigating Cybersecurity Incident
- Freeport-McMoRan Second-Quarter 2023 Financial and Operating Results Release Available on Its Website
- Freeport-McMoRan Declares Quarterly Cash Dividends on Common Stock
- Freeport-McMoRan First-Quarter 2023 Financial and Operating Results Release Available on Its Website
- Freeport-McMoRan Publishes 2022 Annual Report on Sustainability
About author
Online


Add a comment
Comments
0 comments on the analysis FREEPORT-MCMORAN INC. - 1H