RING ENERGY INC. - 1H - Technical analysis published on 02/26/2025 (GMT)
- 67
- 0
Click here for a new analysis!
- Timeframe : 1H
- - Analysis generated on
- Status : TARGET REACHED

Summary of the analysis

Additional analysis
Quotes
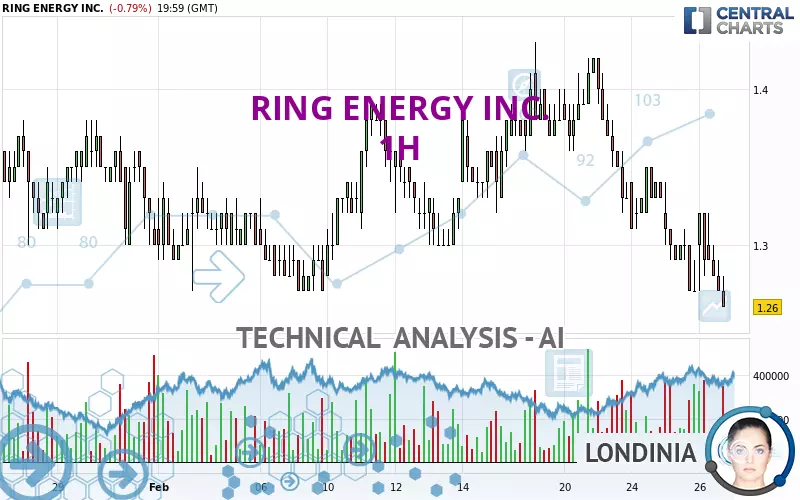
The RING ENERGY INC. price is 1.26 USD. The price registered a decrease of -0.79% on the session and was between 1.26 USD and 1.32 USD. This implies that the price is at 0% from its lowest and at -4.55% from its highest.A bullish opening was detected by the Central Gaps scanner. Buyers are trying to impose a bullish momentum in the very short term.
Bullish opening
Type : Bullish
Timeframe : Openning
A study of price movements over other periods shows the following variations:
Near a new LOW record (1 year)
Type : Bearish
Timeframe : Weekly
New LOW record (1st january)
Type : Bearish
Timeframe : Weekly
New LOW record (1 month)
Type : Bearish
Timeframe : Weekly
Technical
A technical analysis in 1H of this RING ENERGY INC. chart shows a sharp bearish trend. 89.29% of the signals given by moving averages are bearish. The overall trend is supported by the strong bearish signals from short-term moving averages. The Central Indicators scanner does not detect any result on moving averages that would impact this trend.
On the 18 technical indicators analysed, 4 are bullish, 5 are neutral and 9 are bearish. Caution: the Central Indicators scanner currently detects an excess:
CCI indicator is oversold : under -100
Type : Neutral
Timeframe : 1 hour
Williams %R indicator is oversold : under -80
Type : Neutral
Timeframe : 1 hour
Pivot points : price is under support 1
Type : Neutral
Timeframe : Weekly
No signals are given by Central Patterns, a market scanner specialised in chart patterns, resistances and supports.
No result was found by the Central Candlesticks scanner on Japanese candlesticks.
| S1 | Price | R1 | R2 | R3 | |
|---|---|---|---|---|---|
| ProTrendLines | 1.26 | 1.26 | 1.30 | 1.35 | 1.42 |
| Change (%) | 0% | - | +3.17% | +7.14% | +12.70% |
| Change | 0 | - | +0.04 | +0.09 | +0.16 |
| Level | Major | - | Major | Minor | Intermediate |
Attention could also be paid to pivot points to set price objectives:
| Pivot points | S3 | S2 | S1 | PP | R1 | R2 | R3 |
|---|---|---|---|---|---|---|---|
| Standard | 1.18 | 1.22 | 1.25 | 1.29 | 1.32 | 1.36 | 1.39 |
| Camarilla | 1.25 | 1.26 | 1.26 | 1.27 | 1.28 | 1.28 | 1.29 |
| Woodie | 1.17 | 1.22 | 1.24 | 1.29 | 1.31 | 1.36 | 1.38 |
| Fibonacci | 1.22 | 1.25 | 1.27 | 1.29 | 1.32 | 1.34 | 1.36 |
| Pivot points | S3 | S2 | S1 | PP | R1 | R2 | R3 |
|---|---|---|---|---|---|---|---|
| Standard | 1.17 | 1.25 | 1.28 | 1.36 | 1.39 | 1.47 | 1.50 |
| Camarilla | 1.29 | 1.30 | 1.31 | 1.32 | 1.33 | 1.34 | 1.35 |
| Woodie | 1.16 | 1.24 | 1.27 | 1.35 | 1.38 | 1.46 | 1.49 |
| Fibonacci | 1.25 | 1.29 | 1.32 | 1.36 | 1.40 | 1.43 | 1.47 |
| Pivot points | S3 | S2 | S1 | PP | R1 | R2 | R3 |
|---|---|---|---|---|---|---|---|
| Standard | 0.97 | 1.13 | 1.22 | 1.38 | 1.47 | 1.63 | 1.72 |
| Camarilla | 1.23 | 1.25 | 1.28 | 1.30 | 1.32 | 1.35 | 1.37 |
| Woodie | 0.93 | 1.11 | 1.18 | 1.36 | 1.43 | 1.61 | 1.68 |
| Fibonacci | 1.13 | 1.23 | 1.29 | 1.38 | 1.48 | 1.54 | 1.63 |
Numerical data
The following are the details of the technical indicators and moving averages that were collected to generate this technical analysis:
| RSI (14): | 37.65 | |
| MACD (12,26,9): | -0.0200 | |
| Directional Movement: | -9.17 | |
| AROON (14): | -57.14 | |
| DEMA (21): | 1.28 | |
| Parabolic SAR (0,02-0,02-0,2): | 1.32 | |
| Elder Ray (13): | -0.02 | |
| Super Trend (3,10): | 1.34 | |
| Zig ZAG (10): | 1.28 | |
| VORTEX (21): | 0.9000 | |
| Stochastique (14,3,5): | 13.39 | |
| TEMA (21): | 1.27 | |
| Williams %R (14): | -85.71 | |
| Chande Momentum Oscillator (20): | -0.03 | |
| Repulse (5,40,3): | -2.1300 | |
| ROCnROLL: | 2 | |
| TRIX (15,9): | -0.2100 | |
| Courbe Coppock: | 6.62 |
| MA7: | 1.34 | |
| MA20: | 1.33 | |
| MA50: | 1.36 | |
| MA100: | 1.45 | |
| MAexp7: | 1.28 | |
| MAexp20: | 1.31 | |
| MAexp50: | 1.33 | |
| MAexp100: | 1.34 | |
| Price / MA7: | -5.97% | |
| Price / MA20: | -5.26% | |
| Price / MA50: | -7.35% | |
| Price / MA100: | -13.10% | |
| Price / MAexp7: | -1.56% | |
| Price / MAexp20: | -3.82% | |
| Price / MAexp50: | -5.26% | |
| Price / MAexp100: | -5.97% |
News
The latest news and videos published on RING ENERGY INC. at the time of the analysis were as follows:
- Ring Energy Announces Accretive Bolt-On Acquisition
- Ring Energy Announces Issuance of 2024 Sustainability Report
- Ring Energy Announces Addition to Management Team
- Ring Energy Announces Third Quarter 2024 Results, Provides Guidance For Fourth Quarter and Updates Full Year 2024 Outlook
- Ring Energy Announces Timing of Third Quarter 2024 Earnings Release and Conference Call
About author
Online


Add a comment
Comments
0 comments on the analysis RING ENERGY INC. - 1H