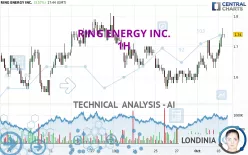
RING ENERGY INC. - 1H - Technical analysis published on 10/03/2024 (GMT)
- 122
- 0
Click here for a new analysis!
- Timeframe : 1H
- - Analysis generated on
- Status : TARGET REACHED

Summary of the analysis

Additional analysis
Quotes
The RING ENERGY INC. price is 1.74 USD. The price registered an increase of +3.57% on the session and was traded between 1.66 USD and 1.76 USD over the period. The price is currently at +4.82% from its lowest and -1.14% from its highest.The Central Gaps scanner detects a bullish opening marking the presence of buyers ahead of sellers at the opening but not sufficiently marked to allow the price to register a quotation gap.
Bullish opening
Type : Bullish
Timeframe : Openning
So that you have an overall view of the price change, here is a table showing the variations over several periods:
Near a new HIGH record (1 month)
Type : Bullish
Timeframe : Weekly
Technical
Technical analysis of this 1H chart of RING ENERGY INC. indicates that the overall trend is bullish. 71.43% of the signals given by moving averages are bullish. The overall trend is reinforced by the strong bullish signals from short-term moving averages. There is no crossing of moving average by the price or crossing of moving averages between themselves.
Technical indicators are strongly bullish, suggesting that the price increase should continue.
Caution: the Central Indicators scanner currently detects an excess:
CCI indicator is overbought : over 100
Type : Neutral
Timeframe : 1 hour
Williams %R indicator is overbought : over -20
Type : Neutral
Timeframe : 1 hour
Pivot points : price is over resistance 1
Type : Neutral
Timeframe : 1 hour
Pivot points : price is over resistance 1
Type : Neutral
Timeframe : Weekly
Central Patterns, the market scanner focusing on chart patterns, resistances and supports found these results:
Near horizontal resistance
Type : Bearish
Timeframe : 1 hour
Near resistance of triangle
Type : Bearish
Timeframe : 1 hour
Resistance of channel is broken
Type : Bullish
Timeframe : 1 hour
The Central Candlesticks scanner which studies Japanese candlesticks did not detect anything.
| S3 | S2 | S1 | Price | R1 | R2 | R3 | |
|---|---|---|---|---|---|---|---|
| ProTrendLines | 1.58 | 1.63 | 1.68 | 1.74 | 1.77 | 1.81 | 1.94 |
| Change (%) | -9.20% | -6.32% | -3.45% | - | +1.72% | +4.02% | +11.49% |
| Change | -0.16 | -0.11 | -0.06 | - | +0.03 | +0.07 | +0.20 |
| Level | Major | Intermediate | Major | - | Intermediate | Intermediate | Minor |
To determine price objectives, it is also possible to use the pivot points. Here is the price position in relation to pivot points:
| Pivot points | S3 | S2 | S1 | PP | R1 | R2 | R3 |
|---|---|---|---|---|---|---|---|
| Standard | 1.54 | 1.59 | 1.63 | 1.68 | 1.72 | 1.77 | 1.81 |
| Camarilla | 1.66 | 1.66 | 1.67 | 1.68 | 1.69 | 1.70 | 1.71 |
| Woodie | 1.55 | 1.59 | 1.64 | 1.68 | 1.73 | 1.77 | 1.82 |
| Fibonacci | 1.59 | 1.62 | 1.64 | 1.68 | 1.71 | 1.73 | 1.77 |
| Pivot points | S3 | S2 | S1 | PP | R1 | R2 | R3 |
|---|---|---|---|---|---|---|---|
| Standard | 1.40 | 1.48 | 1.54 | 1.62 | 1.68 | 1.76 | 1.82 |
| Camarilla | 1.56 | 1.57 | 1.59 | 1.60 | 1.61 | 1.63 | 1.64 |
| Woodie | 1.39 | 1.48 | 1.53 | 1.62 | 1.67 | 1.76 | 1.81 |
| Fibonacci | 1.48 | 1.53 | 1.57 | 1.62 | 1.67 | 1.71 | 1.76 |
| Pivot points | S3 | S2 | S1 | PP | R1 | R2 | R3 |
|---|---|---|---|---|---|---|---|
| Standard | 1.21 | 1.37 | 1.49 | 1.65 | 1.77 | 1.93 | 2.05 |
| Camarilla | 1.52 | 1.55 | 1.57 | 1.60 | 1.63 | 1.65 | 1.68 |
| Woodie | 1.18 | 1.36 | 1.46 | 1.64 | 1.74 | 1.92 | 2.02 |
| Fibonacci | 1.37 | 1.48 | 1.55 | 1.65 | 1.76 | 1.83 | 1.93 |
Numerical data
The following are the details of the technical indicators and moving averages that were collected to generate this technical analysis:
| RSI (14): | 66.51 | |
| MACD (12,26,9): | 0.0200 | |
| Directional Movement: | 23.22 | |
| AROON (14): | 78.57 | |
| DEMA (21): | 1.70 | |
| Parabolic SAR (0,02-0,02-0,2): | 1.64 | |
| Elder Ray (13): | 0.05 | |
| Super Trend (3,10): | 1.64 | |
| Zig ZAG (10): | 1.74 | |
| VORTEX (21): | 1.1500 | |
| Stochastique (14,3,5): | 84.85 | |
| TEMA (21): | 1.73 | |
| Williams %R (14): | -18.44 | |
| Chande Momentum Oscillator (20): | 0.10 | |
| Repulse (5,40,3): | 1.1500 | |
| ROCnROLL: | 1 | |
| TRIX (15,9): | 0.1600 | |
| Courbe Coppock: | 7.30 |
| MA7: | 1.64 | |
| MA20: | 1.67 | |
| MA50: | 1.76 | |
| MA100: | 1.76 | |
| MAexp7: | 1.71 | |
| MAexp20: | 1.68 | |
| MAexp50: | 1.66 | |
| MAexp100: | 1.67 | |
| Price / MA7: | +6.10% | |
| Price / MA20: | +4.19% | |
| Price / MA50: | -1.14% | |
| Price / MA100: | -1.14% | |
| Price / MAexp7: | +1.75% | |
| Price / MAexp20: | +3.57% | |
| Price / MAexp50: | +4.82% | |
| Price / MAexp100: | +4.19% |
News
The last news published on RING ENERGY INC. at the time of the generation of this analysis was as follows:
- Ring Energy Announces Participation In Enercom Denver Conference
- Ring Energy Announces Second Quarter 2024 Results, Provides Guidance for Third Quarter and Updates Full Year 2024 Outlook
- Ring Energy Provides Management Team Update
- Ring Energy Announces Timing of Second Quarter 2024 Earnings Release and Conference Call
- Ring Energy Increases Sales Guidance and Announces Debt Reduction Results for Second Quarter 2024
About author
Online


Add a comment
Comments
0 comments on the analysis RING ENERGY INC. - 1H