EVOLUTION PETROLEUM - Daily - Technical analysis published on 02/26/2025 (GMT)
- 54
- 0
- Timeframe : Daily
- - Analysis generated on
- Status : IN PROGRESS...

Summary of the analysis

Additional analysis
Quotes
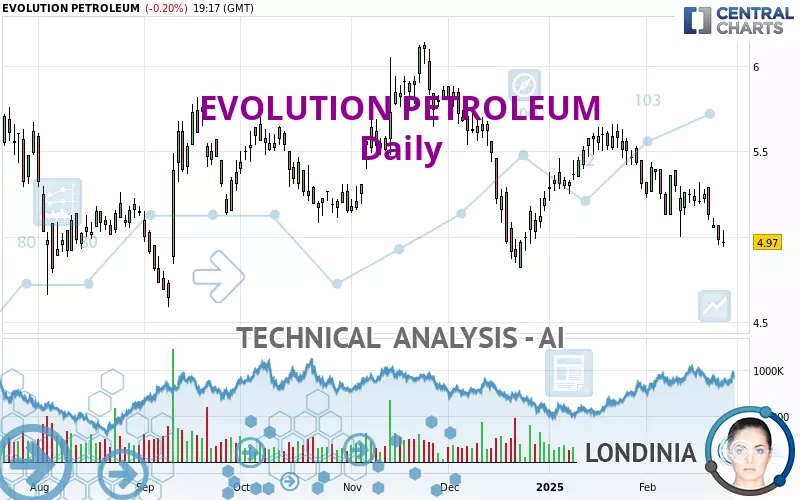
The EVOLUTION PETROLEUM rating is 4.97 USD. On the day, this instrument lost -0.20% and was traded between 4.94 USD and 5.04 USD over the period. The price is currently at +0.61% from its lowest and -1.39% from its highest.The Central Gaps scanner detects a bearish opening. A small advantage for sellers in the very short term.
Bearish opening
Type : Bearish
Timeframe : Openning
A study of price movements over other periods shows the following variations:
New LOW record (1st january)
Type : Bearish
Timeframe : Weekly
New LOW record (1 month)
Type : Bearish
Timeframe : Weekly
Technical
Technical analysis of this Daily chart of EVOLUTION PETROLEUM indicates that the overall trend is strongly bearish. 92.86% of the signals given by moving averages are bearish. The overall trend is supported by the strong bearish signals from short-term moving averages. An assessment of moving averages reveals a bearish signal that could impact this trend:
Moving Average bearish crossovers : AMA20 & AMA50
Type : Bearish
Timeframe : Daily
The probability of a further decline is high given the direction of the technical indicators.
But beware of excesses. The Central Indicators scanner currently detects this:
CCI indicator is oversold : under -100
Type : Neutral
Timeframe : Daily
Previous candle closed under Bollinger bands
Type : Neutral
Timeframe : Daily
RSI indicator: bullish divergence
Type : Bullish
Timeframe : Daily
Williams %R indicator is oversold : under -80
Type : Neutral
Timeframe : Daily
Pivot points : price is under support 1
Type : Neutral
Timeframe : Weekly
Central Patterns, the market scanner focusing on chart patterns, resistances and supports found these results:
Near horizontal support
Type : Bullish
Timeframe : Daily
Support of channel is broken
Type : Bearish
Timeframe : Daily
There is also a Japanese candlestick pattern detected by Central Candlesticks that could mark the end of the current short-term trend:
Doji
Type : Neutral
Timeframe : Daily
| S3 | S2 | S1 | Price | R1 | R2 | R3 | |
|---|---|---|---|---|---|---|---|
| ProTrendLines | 4.45 | 4.61 | 4.88 | 4.97 | 5.04 | 5.54 | 5.84 |
| Change (%) | -10.46% | -7.24% | -1.81% | - | +1.41% | +11.47% | +17.51% |
| Change | -0.52 | -0.36 | -0.09 | - | +0.07 | +0.57 | +0.87 |
| Level | Major | Minor | Intermediate | - | Major | Major | Major |
Pivot points can also be used to set your price objectives. Here is the price situation in relation to pivot points:
| Pivot points | S3 | S2 | S1 | PP | R1 | R2 | R3 |
|---|---|---|---|---|---|---|---|
| Standard | 4.81 | 4.88 | 4.93 | 5.00 | 5.05 | 5.12 | 5.17 |
| Camarilla | 4.95 | 4.96 | 4.97 | 4.98 | 4.99 | 5.00 | 5.01 |
| Woodie | 4.80 | 4.88 | 4.92 | 5.00 | 5.04 | 5.12 | 5.16 |
| Fibonacci | 4.88 | 4.93 | 4.95 | 5.00 | 5.05 | 5.07 | 5.12 |
| Pivot points | S3 | S2 | S1 | PP | R1 | R2 | R3 |
|---|---|---|---|---|---|---|---|
| Standard | 4.83 | 4.96 | 5.05 | 5.18 | 5.27 | 5.40 | 5.49 |
| Camarilla | 5.07 | 5.09 | 5.11 | 5.13 | 5.15 | 5.17 | 5.19 |
| Woodie | 4.80 | 4.95 | 5.02 | 5.17 | 5.24 | 5.39 | 5.46 |
| Fibonacci | 4.96 | 5.05 | 5.10 | 5.18 | 5.27 | 5.32 | 5.40 |
| Pivot points | S3 | S2 | S1 | PP | R1 | R2 | R3 |
|---|---|---|---|---|---|---|---|
| Standard | 4.68 | 4.94 | 5.13 | 5.39 | 5.58 | 5.84 | 6.03 |
| Camarilla | 5.19 | 5.23 | 5.27 | 5.31 | 5.35 | 5.39 | 5.43 |
| Woodie | 4.64 | 4.92 | 5.09 | 5.37 | 5.54 | 5.82 | 5.99 |
| Fibonacci | 4.94 | 5.12 | 5.22 | 5.39 | 5.57 | 5.67 | 5.84 |
Numerical data
The following are the details of the technical indicators and moving averages that were collected to generate this technical analysis:
| RSI (14): | 33.77 | |
| MACD (12,26,9): | -0.0900 | |
| Directional Movement: | -18.07 | |
| AROON (14): | -100.00 | |
| DEMA (21): | 5.11 | |
| Parabolic SAR (0,02-0,02-0,2): | 5.31 | |
| Elder Ray (13): | -0.17 | |
| Super Trend (3,10): | 5.38 | |
| Zig ZAG (10): | 4.97 | |
| VORTEX (21): | 0.8000 | |
| Stochastique (14,3,5): | 8.18 | |
| TEMA (21): | 5.04 | |
| Williams %R (14): | -93.48 | |
| Chande Momentum Oscillator (20): | -0.16 | |
| Repulse (5,40,3): | -3.3700 | |
| ROCnROLL: | 2 | |
| TRIX (15,9): | -0.1600 | |
| Courbe Coppock: | 9.35 |
| MA7: | 5.11 | |
| MA20: | 5.24 | |
| MA50: | 5.29 | |
| MA100: | 5.37 | |
| MAexp7: | 5.09 | |
| MAexp20: | 5.22 | |
| MAexp50: | 5.30 | |
| MAexp100: | 5.31 | |
| Price / MA7: | -2.74% | |
| Price / MA20: | -5.15% | |
| Price / MA50: | -6.05% | |
| Price / MA100: | -7.45% | |
| Price / MAexp7: | -2.36% | |
| Price / MAexp20: | -4.79% | |
| Price / MAexp50: | -6.23% | |
| Price / MAexp100: | -6.40% |
News
The last news published on EVOLUTION PETROLEUM at the time of the generation of this analysis was as follows:
- Evolution Petroleum Reports Fiscal Second Quarter 2025 Results and Declares Quarterly Cash Dividend for Fiscal Third Quarter
- Evolution Petroleum Schedules Fiscal Second Quarter 2025 Earnings Release and Conference Call
- Evolution Petroleum to Participate in Water Tower Research Fireside Chat on November 20th
- Evolution Petroleum Reports First Quarter Fiscal 2025 Results and Declares Quarterly Cash Dividend for the Fiscal 2025 Second Quarter
- Evolution Petroleum Schedules Fiscal First Quarter 2025 Earnings Release and Conference Call
About author
Online


Add a comment
Comments
0 comments on the analysis EVOLUTION PETROLEUM - Daily