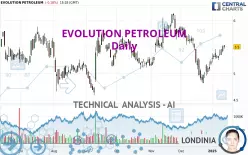
EVOLUTION PETROLEUM - Daily - Technical analysis published on 01/15/2025 (GMT)
- 78
- 0
Click here for a new analysis!
- Timeframe : Daily
- - Analysis generated on
- Status : INVALID

Summary of the analysis

Additional analysis
Quotes
The EVOLUTION PETROLEUM price is 5.50 USD. The price is lower by -0.18% since the last closing and was between 5.47 USD and 5.54 USD. This implies that the price is at +0.55% from its lowest and at -0.72% from its highest.The Central Gaps scanner detects a bearish opening marking the presence of sellers ahead of buyers at the opening but not sufficiently marked to allow the price to register a quotation gap.
Bearish opening
Type : Bearish
Timeframe : Openning
Here is a more detailed summary of the historical variations registered by EVOLUTION PETROLEUM:
New HIGH record (1st january)
Type : Bullish
Timeframe : Weekly
Near a new HIGH record (1 month)
Type : Bullish
Timeframe : Weekly
Technical
Technical analysis of EVOLUTION PETROLEUM in Daily shows an overall bullish trend. 75.00% of the signals given by moving averages are bullish. This bullish trend shows slight signs of slowing down given the slightly bullish signals given by the short-term moving averages. The Central Indicators market scanner currently does not detect any result that concerns moving averages.
An assessment of technical indicators shows a strong bullish signal.
Caution: the Central Indicators scanner currently detects an excess:
CCI indicator is overbought : over 100
Type : Neutral
Timeframe : Daily
Williams %R indicator is overbought : over -20
Type : Neutral
Timeframe : Daily
Pivot points : price is over resistance 1
Type : Neutral
Timeframe : Weekly
MACD indicator is back over 0
Type : Bullish
Timeframe : Daily
Ichimoku - Bullish crossover : Tenkan & Kijun
Type : Bullish
Timeframe : Daily
Central Patterns, the market scanner focusing on chart patterns, resistances and supports found these results:
Near horizontal resistance
Type : Bearish
Timeframe : Daily
Resistance of channel is broken
Type : Bullish
Timeframe : Daily
No result was found by the Central Candlesticks scanner on Japanese candlesticks.
| S3 | S2 | S1 | Price | R1 | R2 | R3 | |
|---|---|---|---|---|---|---|---|
| ProTrendLines | 5.04 | 5.25 | 5.42 | 5.50 | 5.54 | 5.84 | 5.98 |
| Change (%) | -8.36% | -4.55% | -1.45% | - | +0.73% | +6.18% | +8.73% |
| Change | -0.46 | -0.25 | -0.08 | - | +0.04 | +0.34 | +0.48 |
| Level | Major | Intermediate | Intermediate | - | Major | Major | Major |
Attention could also be paid to pivot points to set price objectives:
| Pivot points | S3 | S2 | S1 | PP | R1 | R2 | R3 |
|---|---|---|---|---|---|---|---|
| Standard | 5.30 | 5.35 | 5.43 | 5.48 | 5.56 | 5.61 | 5.69 |
| Camarilla | 5.47 | 5.49 | 5.50 | 5.51 | 5.52 | 5.53 | 5.55 |
| Woodie | 5.32 | 5.36 | 5.45 | 5.49 | 5.58 | 5.62 | 5.71 |
| Fibonacci | 5.35 | 5.40 | 5.43 | 5.48 | 5.53 | 5.56 | 5.61 |
| Pivot points | S3 | S2 | S1 | PP | R1 | R2 | R3 |
|---|---|---|---|---|---|---|---|
| Standard | 5.05 | 5.15 | 5.26 | 5.36 | 5.47 | 5.57 | 5.68 |
| Camarilla | 5.31 | 5.33 | 5.35 | 5.37 | 5.39 | 5.41 | 5.43 |
| Woodie | 5.06 | 5.15 | 5.27 | 5.36 | 5.48 | 5.57 | 5.69 |
| Fibonacci | 5.15 | 5.23 | 5.28 | 5.36 | 5.44 | 5.49 | 5.57 |
| Pivot points | S3 | S2 | S1 | PP | R1 | R2 | R3 |
|---|---|---|---|---|---|---|---|
| Standard | 3.85 | 4.34 | 4.78 | 5.27 | 5.71 | 6.20 | 6.64 |
| Camarilla | 4.97 | 5.06 | 5.15 | 5.23 | 5.32 | 5.40 | 5.49 |
| Woodie | 3.84 | 4.33 | 4.77 | 5.26 | 5.70 | 6.19 | 6.63 |
| Fibonacci | 4.34 | 4.69 | 4.91 | 5.27 | 5.62 | 5.84 | 6.20 |
Numerical data
The following is the status of the technical indicators and moving averages at the time of publication of this technical analysis:
| RSI (14): | 60.82 | |
| MACD (12,26,9): | 0.0100 | |
| Directional Movement: | 11.10 | |
| AROON (14): | 92.86 | |
| DEMA (21): | 5.30 | |
| Parabolic SAR (0,02-0,02-0,2): | 5.11 | |
| Elder Ray (13): | 0.15 | |
| Super Trend (3,10): | 5.04 | |
| Zig ZAG (10): | 5.51 | |
| VORTEX (21): | 0.9500 | |
| Stochastique (14,3,5): | 93.35 | |
| TEMA (21): | 5.34 | |
| Williams %R (14): | -2.82 | |
| Chande Momentum Oscillator (20): | 0.51 | |
| Repulse (5,40,3): | 3.6100 | |
| ROCnROLL: | 1 | |
| TRIX (15,9): | -0.1600 | |
| Courbe Coppock: | 11.09 |
| MA7: | 5.37 | |
| MA20: | 5.20 | |
| MA50: | 5.42 | |
| MA100: | 5.28 | |
| MAexp7: | 5.38 | |
| MAexp20: | 5.31 | |
| MAexp50: | 5.34 | |
| MAexp100: | 5.31 | |
| Price / MA7: | +2.42% | |
| Price / MA20: | +5.77% | |
| Price / MA50: | +1.48% | |
| Price / MA100: | +4.17% | |
| Price / MAexp7: | +2.23% | |
| Price / MAexp20: | +3.58% | |
| Price / MAexp50: | +3.00% | |
| Price / MAexp100: | +3.58% |
News
The last news published on EVOLUTION PETROLEUM at the time of the generation of this analysis was as follows:
- Evolution Petroleum to Participate in Water Tower Research Fireside Chat on November 20th
- Evolution Petroleum Reports First Quarter Fiscal 2025 Results and Declares Quarterly Cash Dividend for the Fiscal 2025 Second Quarter
- Evolution Petroleum Schedules Fiscal First Quarter 2025 Earnings Release and Conference Call
- Evolution Petroleum Reports Fourth Quarter and Full Year Fiscal 2024 Results and Declares Quarterly Cash Dividend for the Fiscal 2025 First Quarter
- Evolution Petroleum Schedules Fiscal Year End 2024 Earnings Release and Conference Call
About author
Online


Add a comment
Comments
0 comments on the analysis EVOLUTION PETROLEUM - Daily