KALVISTA PHARMACEUTICALS INC. - Daily - Technical analysis published on 09/12/2019 (GMT)
- 239
- 0
- Who voted?
Click here for a new analysis!
- Timeframe : Daily
- - Analysis generated on
- Status : TARGET REACHED
Summary of the analysis

Additional analysis
Quotes
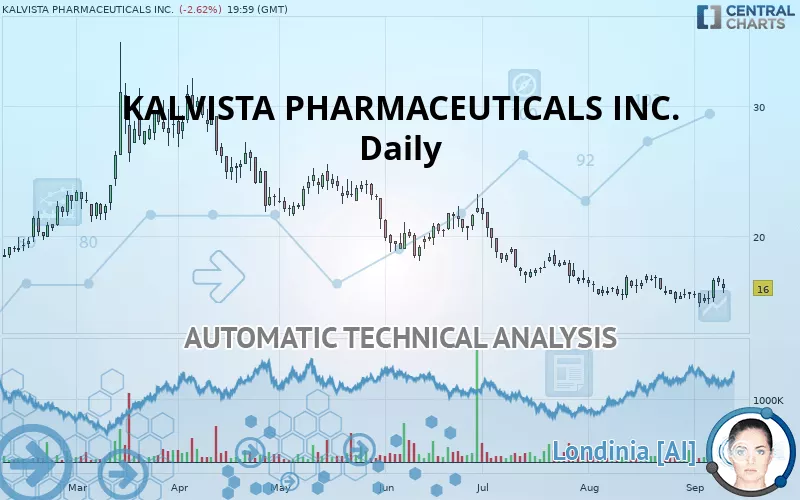
The KALVISTA PHARMACEUTICALS INC. rating is 16.00 USD. The price registered a decrease of -2.62% on the session and was between 15.60 USD and 16.62 USD. This implies that the price is at +2.56% from its lowest and at -3.73% from its highest.A bearish opening was detected by the Central Gaps scanner. Sellers are trying to impose a bearish trend in the very short term.
Bearish opening
Type : Bearish
Timeframe : Openning
Here is a more detailed summary of the historical variations registered by KALVISTA PHARMACEUTICALS INC.:
Near a new HIGH record (1 month)
Type : Bullish
Timeframe : Weekly
Technical
Technical analysis of this Daily chart of KALVISTA PHARMACEUTICALS INC. indicates that the overall trend is bearish. The signals given by moving averages are 75% bearish. This bearish trend could slow down given the neutral signals currently being given by short-term moving averages. There is no crossing of moving average by the price or crossing of moving averages between themselves.
In fact, 11 technical indicators on 18 studied are currently bullish. But beware of excesses. The Central Indicators scanner currently detects this:
Williams %R indicator is overbought : over -20
Type : Neutral
Timeframe : Daily
Pivot points : price is over resistance 1
Type : Neutral
Timeframe : Weekly
Pivot points : price is under support 1
Type : Neutral
Timeframe : Daily
RSI indicator is back under 50
Type : Bearish
Timeframe : Daily
Price is back under the pivot point
Type : Bearish
Timeframe : Weekly
The analysis of the price chart with Central Patterns scanners does not return any result.
The Central Candlesticks scanner which studies Japanese candlesticks did not detect anything.
| S3 | S2 | S1 | Price | R1 | R2 | R3 | |
|---|---|---|---|---|---|---|---|
| ProTrendLines | 7.84 | 9.84 | 13.54 | 16.00 | 16.51 | 22.11 | 24.06 |
| Change (%) | -51.00% | -38.50% | -15.38% | - | +3.19% | +38.19% | +50.38% |
| Change | -8.16 | -6.16 | -2.46 | - | +0.51 | +6.11 | +8.06 |
| Level | Major | Minor | Major | - | Major | Intermediate | Intermediate |
Attention could also be paid to pivot points to set price objectives:
| Pivot points | S3 | S2 | S1 | PP | R1 | R2 | R3 |
|---|---|---|---|---|---|---|---|
| Standard | 15.28 | 15.69 | 16.06 | 16.46 | 16.83 | 17.24 | 17.61 |
| Camarilla | 16.22 | 16.29 | 16.36 | 16.43 | 16.50 | 16.57 | 16.64 |
| Woodie | 15.27 | 15.68 | 16.04 | 16.45 | 16.82 | 17.23 | 17.60 |
| Fibonacci | 15.69 | 15.98 | 16.17 | 16.46 | 16.76 | 16.94 | 17.24 |
| Pivot points | S3 | S2 | S1 | PP | R1 | R2 | R3 |
|---|---|---|---|---|---|---|---|
| Standard | 13.21 | 13.86 | 14.48 | 15.13 | 15.75 | 16.40 | 17.02 |
| Camarilla | 14.76 | 14.88 | 14.99 | 15.11 | 15.23 | 15.34 | 15.46 |
| Woodie | 13.21 | 13.85 | 14.48 | 15.12 | 15.75 | 16.39 | 17.02 |
| Fibonacci | 13.86 | 14.34 | 14.64 | 15.13 | 15.61 | 15.91 | 16.40 |
| Pivot points | S3 | S2 | S1 | PP | R1 | R2 | R3 |
|---|---|---|---|---|---|---|---|
| Standard | 12.41 | 13.62 | 14.62 | 15.83 | 16.83 | 18.04 | 19.04 |
| Camarilla | 15.01 | 15.22 | 15.42 | 15.62 | 15.82 | 16.03 | 16.23 |
| Woodie | 12.31 | 13.57 | 14.52 | 15.78 | 16.73 | 17.99 | 18.94 |
| Fibonacci | 13.62 | 14.46 | 14.99 | 15.83 | 16.67 | 17.20 | 18.04 |
Numerical data
The following are the details of the technical indicators and moving averages that were collected to generate this technical analysis:
| RSI (14): | 49.07 | |
| MACD (12,26,9): | -0.2700 | |
| Directional Movement: | -4.33 | |
| AROON (14): | -64.29 | |
| DEMA (21): | 15.44 | |
| Parabolic SAR (0,02-0,02-0,2): | 14.64 | |
| Elder Ray (13): | 0.31 | |
| Super Trend (3,10): | 17.33 | |
| Zig ZAG (10): | 16.00 | |
| VORTEX (21): | 1.0200 | |
| Stochastique (14,3,5): | 75.09 | |
| TEMA (21): | 15.79 | |
| Williams %R (14): | -36.62 | |
| Chande Momentum Oscillator (20): | 0.41 | |
| Repulse (5,40,3): | 1.3000 | |
| ROCnROLL: | -1 | |
| TRIX (15,9): | -0.3700 | |
| Courbe Coppock: | 6.06 |
| MA7: | 15.65 | |
| MA20: | 15.84 | |
| MA50: | 16.70 | |
| MA100: | 19.46 | |
| MAexp7: | 15.86 | |
| MAexp20: | 15.90 | |
| MAexp50: | 17.00 | |
| MAexp100: | 18.62 | |
| Price / MA7: | +2.24% | |
| Price / MA20: | +1.01% | |
| Price / MA50: | -4.19% | |
| Price / MA100: | -17.78% | |
| Price / MAexp7: | +0.88% | |
| Price / MAexp20: | +0.63% | |
| Price / MAexp50: | -5.88% | |
| Price / MAexp100: | -14.07% |
News
Don"t forget to follow the news on KALVISTA PHARMACEUTICALS INC.. At the time of publication of this analysis, the latest news was as follows:
- KalVista Pharmaceuticals Reports Fiscal First Quarter Results
- KalVista Pharmaceuticals Provides Operational Update and Reports Fiscal Fourth Quarter and Full Year Financial Results
- KalVista Pharmaceuticals to Present at Jefferies Healthcare Conference
- KalVista Pharmaceuticals to Recognize HAE Day 2017
- KalVista Pharmaceuticals Reports Fiscal Third Quarter Results
About author

Online


Add a comment
Comments
0 comments on the analysis KALVISTA PHARMACEUTICALS INC. - Daily