PROQR THERAPEUTICS N.V. - Daily - Technical analysis published on 09/09/2019 (GMT)
- 318
- 0
- Who voted?
Click here for a new analysis!
- Timeframe : Daily
- - Analysis generated on
- Status : TARGET REACHED
Summary of the analysis

Additional analysis
Quotes
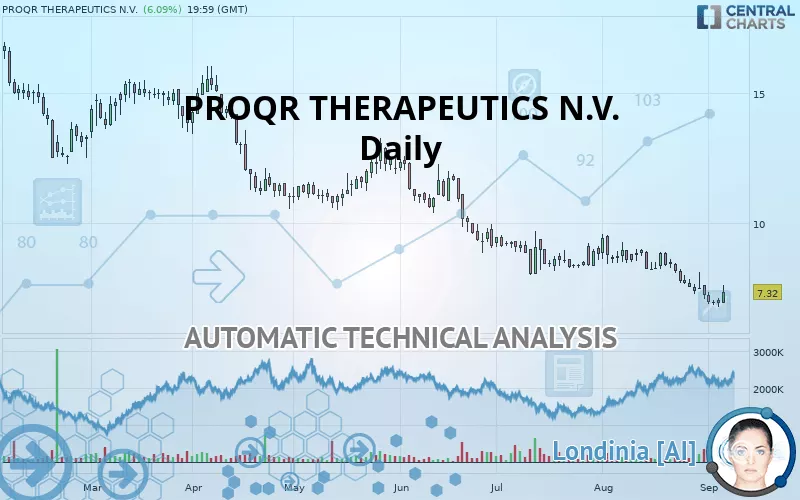
The PROQR THERAPEUTICS N.V. rating is 7.32 USD. On the day, this instrument gained +6.09% with the lowest point at 6.87 USD and the highest point at 7.59 USD. The deviation from the price is +6.55% for the low point and -3.56% for the high point.The Central Gaps scanner detects a bullish opening marking the presence of sellers ahead of buyers at the opening but not sufficiently marked to allow the price to register a quotation gap.
Bearish opening
Type : Bearish
Timeframe : Openning
A study of price movements over other periods shows the following variations:
Near a new LOW record (1 year)
Type : Bearish
Timeframe : Weekly
Near a new LOW record (1st january)
Type : Bearish
Timeframe : Weekly
Near a new LOW record (1 month)
Type : Bearish
Timeframe : Weekly
Technical
A technical analysis in Daily of this PROQR THERAPEUTICS N.V. chart shows a sharp bearish trend. 92.86% of the signals given by moving averages are bearish. This strongly bearish trend is supported by the strong bearish signals given by short-term moving averages. The Central Indicators scanner does not detect any result on moving averages that would impact this trend.
An assessment of technical indicators does not currently provide any relevant information on the direction of future price movements.
Caution: the Central Indicators scanner currently detects an excess:
CCI indicator is oversold : under -100
Type : Neutral
Timeframe : Daily
Williams %R indicator is oversold : under -80
Type : Neutral
Timeframe : Daily
Pivot points : price is over resistance 2
Type : Neutral
Timeframe : Daily
Price is back under the pivot point
Type : Bearish
Timeframe : Weekly
The analysis of the price chart with Central Patterns scanners does not return any result.
The Central Candlesticks scanner, specialised in Japanese candlesticks, did not identify any signals.
| S2 | S1 | Price | R1 | R2 | R3 | |
|---|---|---|---|---|---|---|
| ProTrendLines | 3.77 | 6.52 | 7.32 | 9.39 | 13.08 | 15.51 |
| Change (%) | -48.50% | -10.93% | - | +28.28% | +78.69% | +111.89% |
| Change | -3.55 | -0.80 | - | +2.07 | +5.76 | +8.19 |
| Level | Minor | Major | - | Intermediate | Intermediate | Major |
Attention could also be paid to pivot points to set price objectives:
| Pivot points | S3 | S2 | S1 | PP | R1 | R2 | R3 |
|---|---|---|---|---|---|---|---|
| Standard | 6.40 | 6.57 | 6.73 | 6.90 | 7.06 | 7.23 | 7.39 |
| Camarilla | 6.81 | 6.84 | 6.87 | 6.90 | 6.93 | 6.96 | 6.99 |
| Woodie | 6.41 | 6.57 | 6.74 | 6.90 | 7.07 | 7.23 | 7.40 |
| Fibonacci | 6.57 | 6.69 | 6.77 | 6.90 | 7.02 | 7.10 | 7.23 |
| Pivot points | S3 | S2 | S1 | PP | R1 | R2 | R3 |
|---|---|---|---|---|---|---|---|
| Standard | 5.74 | 6.38 | 6.79 | 7.43 | 7.84 | 8.48 | 8.89 |
| Camarilla | 6.90 | 7.00 | 7.09 | 7.19 | 7.29 | 7.38 | 7.48 |
| Woodie | 5.62 | 6.32 | 6.67 | 7.37 | 7.72 | 8.42 | 8.77 |
| Fibonacci | 6.38 | 6.78 | 7.03 | 7.43 | 7.83 | 8.08 | 8.48 |
| Pivot points | S3 | S2 | S1 | PP | R1 | R2 | R3 |
|---|---|---|---|---|---|---|---|
| Standard | 3.79 | 5.41 | 6.30 | 7.92 | 8.81 | 10.44 | 11.33 |
| Camarilla | 6.50 | 6.73 | 6.96 | 7.19 | 7.42 | 7.65 | 7.88 |
| Woodie | 3.42 | 5.22 | 5.93 | 7.74 | 8.45 | 10.25 | 10.96 |
| Fibonacci | 5.41 | 6.37 | 6.96 | 7.92 | 8.88 | 9.48 | 10.44 |
Numerical data
The following are the details of the technical indicators and moving averages that were collected to generate this technical analysis:
| RSI (14): | 39.74 | |
| MACD (12,26,9): | -0.4700 | |
| Directional Movement: | -1.45 | |
| AROON (14): | -78.57 | |
| DEMA (21): | 7.13 | |
| Parabolic SAR (0,02-0,02-0,2): | 6.73 | |
| Elder Ray (13): | -0.25 | |
| Super Trend (3,10): | 8.24 | |
| Zig ZAG (10): | 7.32 | |
| VORTEX (21): | 0.8200 | |
| Stochastique (14,3,5): | 14.09 | |
| TEMA (21): | 7.01 | |
| Williams %R (14): | -72.43 | |
| Chande Momentum Oscillator (20): | -1.03 | |
| Repulse (5,40,3): | 0.7600 | |
| ROCnROLL: | 2 | |
| TRIX (15,9): | -0.6500 | |
| Courbe Coppock: | 30.63 |
| MA7: | 7.15 | |
| MA20: | 7.88 | |
| MA50: | 8.42 | |
| MA100: | 9.86 | |
| MAexp7: | 7.23 | |
| MAexp20: | 7.72 | |
| MAexp50: | 8.58 | |
| MAexp100: | 9.86 | |
| Price / MA7: | +2.38% | |
| Price / MA20: | -7.11% | |
| Price / MA50: | -13.06% | |
| Price / MA100: | -25.76% | |
| Price / MAexp7: | +1.24% | |
| Price / MAexp20: | -5.18% | |
| Price / MAexp50: | -14.69% | |
| Price / MAexp100: | -25.76% |
News
The last news published on PROQR THERAPEUTICS N.V. at the time of the generation of this analysis was as follows:
- Consolidated Research: 2018 Summary Expectations for ProQR Therapeutics N.V, Biomerica, VEREIT, Apergy, Zendesk, and Arcus Biosciences — Fundamental Analysis, Key Performance Indications
- ProQR Announces Results for the Third Quarter of 2016
- ProQR Announces that QR-010 Meets the Primary Endpoint in a Proof of Concept Study of Homozygous F508del Cystic Fibrosis Patients
About author

Online


Add a comment
Comments
0 comments on the analysis PROQR THERAPEUTICS N.V. - Daily