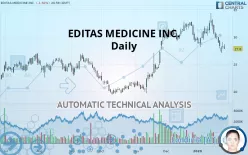
EDITAS MEDICINE INC. - Daily - Technical analysis published on 01/30/2020 (GMT)
- 305
- 0
- Who voted?
Click here for a new analysis!
- Timeframe : Daily
- - Analysis generated on
- Status : TARGET REACHED

Summary of the analysis

Additional analysis
Quotes
EDITAS MEDICINE INC. rating 27.80 USD. The price is lower by -1.56% since the last closing and was between 27.76 USD and 28.67 USD. This implies that the price is at +0.14% from its lowest and at -3.03% from its highest.The Central Gaps scanner detects a bullish opening marking the presence of buyers ahead of sellers at the opening but not sufficiently marked to allow the price to register a quotation gap.
Bullish opening
Type : Bullish
Timeframe : Openning
A study of price movements over other periods shows the following variations:
Near a new LOW record (1st january)
Type : Bearish
Timeframe : Weekly
Near a new LOW record (1 month)
Type : Bearish
Timeframe : Weekly
Technical
Technical analysis of EDITAS MEDICINE INC. in Daily shows an overall slightly bullish trend. 57.14% of the signals given by moving averages are bullish. Caution: the strong bearish signals currently being given by short-term moving averages indicate that this slightly bullish trend could be reversed. The Central Indicators market scanner currently does not detect any result that concerns moving averages.
An assessment of technical indicators shows a bearish signal.
Caution: the Central Indicators scanner currently detects an excess:
CCI indicator is oversold : under -100
Type : Neutral
Timeframe : Daily
MACD indicator: bullish divergence
Type : Bullish
Timeframe : Daily
Williams %R indicator is oversold : under -80
Type : Neutral
Timeframe : Daily
Price is back under the pivot point
Type : Bearish
Timeframe : Weekly
An analysis of the price chart with the Central Patterns scanner (detector of chart patterns and resistances and supports) shows a result that can have an impact on the price change:
Near support of channel
Type : Bullish
Timeframe : Daily
The Central Candlesticks scanner currently notes the presence of this pattern in Japanese candlesticks that could mark the end of the short-term trend currently underway:
Doji
Type : Neutral
Timeframe : Daily
| S3 | S2 | S1 | Price | R1 | R2 | R3 | |
|---|---|---|---|---|---|---|---|
| ProTrendLines | 21.65 | 23.89 | 27.35 | 27.80 | 29.00 | 31.79 | 37.09 |
| Change (%) | -22.12% | -14.06% | -1.62% | - | +4.32% | +14.35% | +33.42% |
| Change | -6.15 | -3.91 | -0.45 | - | +1.20 | +3.99 | +9.29 |
| Level | Minor | Intermediate | Major | - | Major | Major | Minor |
Attention could also be paid to pivot points to set price objectives:
| Pivot points | S3 | S2 | S1 | PP | R1 | R2 | R3 |
|---|---|---|---|---|---|---|---|
| Standard | 26.53 | 27.18 | 27.71 | 28.36 | 28.89 | 29.54 | 30.07 |
| Camarilla | 27.92 | 28.02 | 28.13 | 28.24 | 28.35 | 28.46 | 28.56 |
| Woodie | 26.47 | 27.15 | 27.65 | 28.33 | 28.83 | 29.51 | 30.01 |
| Fibonacci | 27.18 | 27.63 | 27.91 | 28.36 | 28.81 | 29.09 | 29.54 |
| Pivot points | S3 | S2 | S1 | PP | R1 | R2 | R3 |
|---|---|---|---|---|---|---|---|
| Standard | 24.24 | 26.07 | 27.21 | 29.04 | 30.18 | 32.01 | 33.15 |
| Camarilla | 27.53 | 27.81 | 28.08 | 28.35 | 28.62 | 28.90 | 29.17 |
| Woodie | 23.90 | 25.90 | 26.87 | 28.87 | 29.84 | 31.84 | 32.81 |
| Fibonacci | 26.07 | 27.21 | 27.91 | 29.04 | 30.18 | 30.88 | 32.01 |
| Pivot points | S3 | S2 | S1 | PP | R1 | R2 | R3 |
|---|---|---|---|---|---|---|---|
| Standard | 24.40 | 26.72 | 28.17 | 30.49 | 31.94 | 34.26 | 35.71 |
| Camarilla | 28.57 | 28.92 | 29.26 | 29.61 | 29.96 | 30.30 | 30.65 |
| Woodie | 23.96 | 26.50 | 27.73 | 30.27 | 31.50 | 34.04 | 35.27 |
| Fibonacci | 26.72 | 28.16 | 29.05 | 30.49 | 31.93 | 32.82 | 34.26 |
Numerical data
The following is the status of technical indicators and moving averages registered at the time this technical analysis was created:
| RSI (14): | 37.57 | |
| MACD (12,26,9): | -0.3600 | |
| Directional Movement: | -6.34 | |
| AROON (14): | -50.00 | |
| DEMA (21): | 29.52 | |
| Parabolic SAR (0,02-0,02-0,2): | 32.67 | |
| Elder Ray (13): | -1.20 | |
| Super Trend (3,10): | 31.82 | |
| Zig ZAG (10): | 27.80 | |
| VORTEX (21): | 0.9100 | |
| Stochastique (14,3,5): | 13.26 | |
| TEMA (21): | 28.38 | |
| Williams %R (14): | -89.51 | |
| Chande Momentum Oscillator (20): | -2.88 | |
| Repulse (5,40,3): | -4.8200 | |
| ROCnROLL: | 2 | |
| TRIX (15,9): | 0.0600 | |
| Courbe Coppock: | 8.79 |
| MA7: | 28.76 | |
| MA20: | 30.02 | |
| MA50: | 29.56 | |
| MA100: | 25.89 | |
| MAexp7: | 28.76 | |
| MAexp20: | 29.70 | |
| MAexp50: | 28.85 | |
| MAexp100: | 27.18 | |
| Price / MA7: | -3.34% | |
| Price / MA20: | -7.40% | |
| Price / MA50: | -5.95% | |
| Price / MA100: | +7.38% | |
| Price / MAexp7: | -3.34% | |
| Price / MAexp20: | -6.40% | |
| Price / MAexp50: | -3.64% | |
| Price / MAexp100: | +2.28% |
News
The last news published on EDITAS MEDICINE INC. at the time of the generation of this analysis was as follows:
- Editas Medicine Reports on Recent Progress at J.P. Morgan Healthcare Conference
- Editas Medicine and Sandhill Therapeutics, Inc. Announce Collaboration to Develop Engineered Cell Medicines to Treat Cancer
- Editas Medicine Reports Inducement Grants to New Chief Financial Officer
- Editas Medicine Strengthens Executive Leadership Team to Support Long-term Growth
- Editas Medicine to Present at the 38th Annual J.P. Morgan Healthcare Conference
About author

Online


Add a comment
Comments
0 comments on the analysis EDITAS MEDICINE INC. - Daily