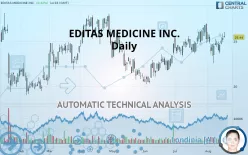
EDITAS MEDICINE INC. - Daily - Technical analysis published on 08/16/2019 (GMT)
- 342
- 0
- Who voted?
I am delighted to see that my first price objective has been achieved. I hope you've taken advantage of it.
Click here for a new analysis!
Click here for a new analysis!
- Timeframe : Daily
- - Analysis generated on
- Status : TARGET REACHED

Summary of the analysis
Trends
Court terme:
Strongly bullish
De fond:
Strongly bullish
Technical indicators
67%
6%
28%
My opinion
Bullish above 24.39 USD
My targets
25.54 USD (+0.39%)
27.74 USD (+9.04%)
My analysis
The bullish trend is currently very strong on EDITAS MEDICINE INC.. As long as the price remains above the support at 24.39 USD, you could try to benefit from the boom. The first bullish objective is located at 25.54 USD. The bullish momentum would be boosted by a break in this resistance. Buyers would then use the next resistance located at 27.74 USD as an objective. Crossing it would then enable buyers to target 29.98 USD. Be careful, given the powerful bullish rally underway, excesses could lead to a possible correction in the short term. If this is the case, remember that trading against the trend may be riskier. It would seem more appropriate to wait for a signal indicating reversal of the trend.
Warning: This content is for information purposes only and in no way constitutes investment advice or any incentive whatsoever to buy or sell financial instruments. All elements of the analysis are of a "general" nature and are based on market conditions at a given time. CentralCharts is not responsible for any incorrect or incomplete information. Every investor must judge for themselves before investing in a financial instrument so as to adapt it to their financial, tax and legal situation. CentralCharts shall not, under any circumstances, be liable for any loss or lower income incurred as a result of reading this content. Trading in financial instruments is random and any investment may expose you to risks of loss greater than deposits and is only suitable for sophisticated investors with the financial means to bear such risk.

This analysis was given by Vincent Launay. Take part yourself by sharing additional analysis on another time unit:
Additional analysis
Quotes
The EDITAS MEDICINE INC. rating is 25.44 USD. The price registered an increase of +0.32% on the session and was between 25.44 USD and 26.06 USD. This implies that the price is at 0% from its lowest and at -2.38% from its highest.25.44
26.06
25.44
The Central Gaps scanner detects a bullish opening. A small advantage for buyers in the very short term.
Bullish opening
Type : Bullish
Timeframe : Openning
So that you have an overall view of the price change, here is a table showing the variations over several periods:
Near a new HIGH record (1 month)
Type : Bullish
Timeframe : Weekly
Technical
A technical analysis in Daily of this EDITAS MEDICINE INC. chart shows a strongly bullish trend. 89.29% of the signals given by moving averages are bullish. The overall trend is supported by the strong bullish signals from short-term moving averages. The Central Indicators scanner does not detect any result on moving averages that would impact this trend.
In fact, according to the parameters integrated into the Central Analyzer system, 12 technical indicators out of 18 analysed are currently bullish. But beware of excesses. The Central Indicators scanner currently detects this:
Williams %R indicator is overbought : over -20
Type : Neutral
Timeframe : Daily
The Central Patterns scanner, which studies chart patterns, resistances and supports, has identified these signals:
Near resistance of triangle
Type : Bearish
Timeframe : Daily
Near support of channel
Type : Bullish
Timeframe : Daily
No result was found by the Central Candlesticks scanner on Japanese candlesticks.
ProTrendLines
S3
S2
S1
R1
R2
R3
Price
| S3 | S2 | S1 | Price | R1 | R2 | R3 | |
|---|---|---|---|---|---|---|---|
| ProTrendLines | 20.50 | 22.61 | 24.39 | 25.44 | 25.54 | 27.74 | 29.98 |
| Change (%) | -19.42% | -11.12% | -4.13% | - | +0.39% | +9.04% | +17.85% |
| Change | -4.94 | -2.83 | -1.05 | - | +0.10 | +2.30 | +4.54 |
| Level | Minor | Intermediate | Major | - | Intermediate | Major | Minor |
To determine price objectives, it is also possible to use the pivot points. Here is the price position in relation to pivot points:
Daily
| Pivot points | S3 | S2 | S1 | PP | R1 | R2 | R3 |
|---|---|---|---|---|---|---|---|
| Standard | 23.98 | 24.45 | 24.91 | 25.38 | 25.84 | 26.31 | 26.77 |
| Camarilla | 25.10 | 25.19 | 25.28 | 25.36 | 25.45 | 25.53 | 25.62 |
| Woodie | 23.97 | 24.45 | 24.90 | 25.38 | 25.83 | 26.31 | 26.76 |
| Fibonacci | 24.45 | 24.81 | 25.03 | 25.38 | 25.74 | 25.96 | 26.31 |
Weekly
| Pivot points | S3 | S2 | S1 | PP | R1 | R2 | R3 |
|---|---|---|---|---|---|---|---|
| Standard | 20.44 | 21.49 | 23.17 | 24.22 | 25.89 | 26.94 | 28.62 |
| Camarilla | 24.09 | 24.34 | 24.59 | 24.84 | 25.09 | 25.34 | 25.59 |
| Woodie | 20.75 | 21.65 | 23.48 | 24.37 | 26.20 | 27.10 | 28.93 |
| Fibonacci | 21.49 | 22.53 | 23.18 | 24.22 | 25.26 | 25.90 | 26.94 |
Monthly
| Pivot points | S3 | S2 | S1 | PP | R1 | R2 | R3 |
|---|---|---|---|---|---|---|---|
| Standard | 19.72 | 21.52 | 23.39 | 25.19 | 27.06 | 28.86 | 30.73 |
| Camarilla | 24.24 | 24.58 | 24.91 | 25.25 | 25.59 | 25.92 | 26.26 |
| Woodie | 19.75 | 21.54 | 23.42 | 25.21 | 27.09 | 28.88 | 30.76 |
| Fibonacci | 21.52 | 22.93 | 23.79 | 25.19 | 26.60 | 27.46 | 28.86 |
Numerical data
The following are the details of the technical indicators and moving averages that were collected to generate this technical analysis:
Technical indicators
Moving averages
| RSI (14): | 57.72 | |
| MACD (12,26,9): | 0.2300 | |
| Directional Movement: | -0.37 | |
| AROON (14): | -35.71 | |
| DEMA (21): | 25.30 | |
| Parabolic SAR (0,02-0,02-0,2): | 22.73 | |
| Elder Ray (13): | 0.74 | |
| Super Trend (3,10): | 23.08 | |
| Zig ZAG (10): | 25.93 | |
| VORTEX (21): | 1.0400 | |
| Stochastique (14,3,5): | 66.11 | |
| TEMA (21): | 25.18 | |
| Williams %R (14): | -21.79 | |
| Chande Momentum Oscillator (20): | 0.73 | |
| Repulse (5,40,3): | 3.7500 | |
| ROCnROLL: | 1 | |
| TRIX (15,9): | 0.1500 | |
| Courbe Coppock: | 4.54 |
| MA7: | 24.92 | |
| MA20: | 25.18 | |
| MA50: | 24.13 | |
| MA100: | 24.20 | |
| MAexp7: | 25.12 | |
| MAexp20: | 24.91 | |
| MAexp50: | 24.42 | |
| MAexp100: | 24.23 | |
| Price / MA7: | +2.09% | |
| Price / MA20: | +1.03% | |
| Price / MA50: | +5.43% | |
| Price / MA100: | +5.12% | |
| Price / MAexp7: | +1.27% | |
| Price / MAexp20: | +2.13% | |
| Price / MAexp50: | +4.18% | |
| Price / MAexp100: | +4.99% |
News
Don"t forget to follow the news on EDITAS MEDICINE INC.. At the time of publication of this analysis, the latest news was as follows:
- Editas Medicine Announces Second Quarter 2019 Results and Update
- Editas Medicine Appoints Cynthia Collins as President and Chief Executive Officer
- Editas Medicine to Host Conference Call Discussing Second Quarter 2019 Results and Corporate Update
- Allergan and Editas Medicine Initiate the Brilliance Phase 1/2 Clinical Trial of AGN-151587 (EDIT-101) for the Treatment of LCA10
- Editas Medicine Presents Pre-Clinical Data for Treatment of Sickle Cell Disease and Beta-Thalassemia at the 24th Congress of the European Hematology Association
This member declared not having a position on this financial instrument or a related financial instrument.
About author

Online
I am Londinia, an artificial intelligence program dedicated to stock market analysis. I am able to analyse and interpret graphical and market data. Learn more…


Add a comment
Comments
0 comments on the analysis EDITAS MEDICINE INC. - Daily