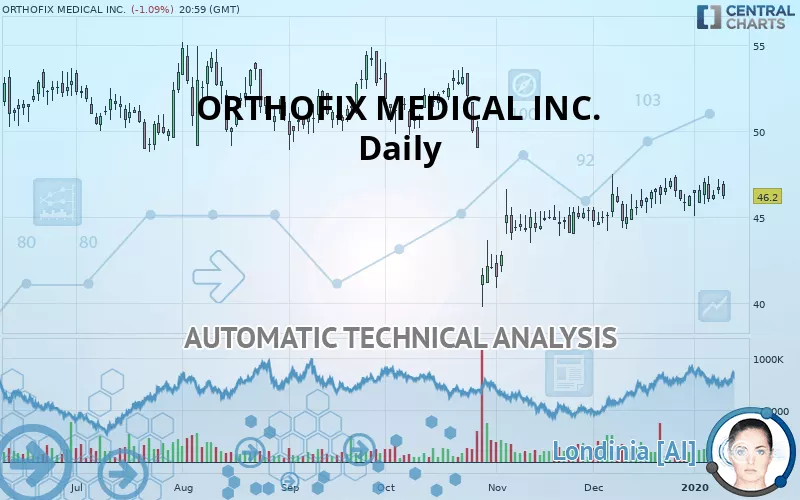
ORTHOFIX MEDICAL INC. - Daily - Technical analysis published on 01/13/2020 (GMT)
- 266
- 0
- Who voted?
Click here for a new analysis!
- Timeframe : Daily
- - Analysis generated on
- Status : INVALID
Summary of the analysis

Additional analysis
Quotes
The ORTHOFIX MEDICAL INC. price is 46.20 USD. The price registered a decrease of -1.09% on the session and was between 46.05 USD and 47.11 USD. This implies that the price is at +0.33% from its lowest and at -1.93% from its highest.The Central Gaps scanner detects a bullish opening marking the presence of buyers ahead of sellers at the opening but not sufficiently marked to allow the price to register a quotation gap.
Bullish opening
Type : Bullish
Timeframe : Openning
A study of price movements over other periods shows the following variations:
Technical
Technical analysis of this Daily chart of ORTHOFIX MEDICAL INC. indicates that the overall trend is bearish. The signals given by moving averages are 71.43% bearish. This bearish trend could slow down given the neutral signals currently being given by short-term moving averages. The Central Indicators market scanner is currently detecting a bullish signal that could impact this trend:
Bullish price crossover with adaptative moving average 50
Type : Bullish
Timeframe : Daily
In fact, Central Analyzer took into account 18 technical indicators and the result was as follows: 5 are bullish, 6 are neutral and 7 are bearish. Caution: the Central Indicators scanner currently detects an excess:
Williams %R indicator is overbought : over -20
Type : Neutral
Timeframe : Daily
Pivot points : price is under support 1
Type : Neutral
Timeframe : Daily
Price is back over the pivot point
Type : Bullish
Timeframe : Weekly
Momentum indicator is back over 0
Type : Bullish
Timeframe : Daily
Central Patterns, the scanner specializing in chart patterns, did not identify any signals.
No result was found by the Central Candlesticks scanner on Japanese candlesticks.
| S3 | S2 | S1 | Price | R1 | R2 | R3 | |
|---|---|---|---|---|---|---|---|
| ProTrendLines | 41.56 | 44.07 | 45.76 | 46.20 | 47.07 | 48.76 | 53.55 |
| Change (%) | -10.04% | -4.61% | -0.95% | - | +1.88% | +5.54% | +15.91% |
| Change | -4.64 | -2.13 | -0.44 | - | +0.87 | +2.56 | +7.35 |
| Level | Major | Intermediate | Major | - | Intermediate | Major | Intermediate |
To determine price objectives, it is also possible to use the pivot points. Here is the price position in relation to pivot points:
| Pivot points | S3 | S2 | S1 | PP | R1 | R2 | R3 |
|---|---|---|---|---|---|---|---|
| Standard | 45.42 | 45.86 | 46.29 | 46.73 | 47.16 | 47.60 | 48.03 |
| Camarilla | 46.47 | 46.55 | 46.63 | 46.71 | 46.79 | 46.87 | 46.95 |
| Woodie | 45.41 | 45.86 | 46.28 | 46.73 | 47.15 | 47.60 | 48.02 |
| Fibonacci | 45.86 | 46.20 | 46.40 | 46.73 | 47.07 | 47.27 | 47.60 |
| Pivot points | S3 | S2 | S1 | PP | R1 | R2 | R3 |
|---|---|---|---|---|---|---|---|
| Standard | 43.61 | 44.33 | 45.43 | 46.15 | 47.25 | 47.97 | 49.07 |
| Camarilla | 46.04 | 46.21 | 46.37 | 46.54 | 46.71 | 46.87 | 47.04 |
| Woodie | 43.81 | 44.43 | 45.63 | 46.25 | 47.45 | 48.07 | 49.27 |
| Fibonacci | 44.33 | 45.02 | 45.45 | 46.15 | 46.84 | 47.27 | 47.97 |
| Pivot points | S3 | S2 | S1 | PP | R1 | R2 | R3 |
|---|---|---|---|---|---|---|---|
| Standard | 41.11 | 42.65 | 44.41 | 45.95 | 47.71 | 49.25 | 51.01 |
| Camarilla | 45.27 | 45.58 | 45.88 | 46.18 | 46.48 | 46.79 | 47.09 |
| Woodie | 41.23 | 42.71 | 44.53 | 46.01 | 47.83 | 49.31 | 51.13 |
| Fibonacci | 42.65 | 43.91 | 44.69 | 45.95 | 47.21 | 47.99 | 49.25 |
Numerical data
The following are the details of the technical indicators and moving averages that were collected to generate this technical analysis:
| RSI (14): | 50.34 | |
| MACD (12,26,9): | 0.1800 | |
| Directional Movement: | 1.98 | |
| AROON (14): | -28.57 | |
| DEMA (21): | 46.42 | |
| Parabolic SAR (0,02-0,02-0,2): | 44.96 | |
| Elder Ray (13): | 0.26 | |
| Super Trend (3,10): | 47.10 | |
| Zig ZAG (10): | 46.20 | |
| VORTEX (21): | 1.0800 | |
| Stochastique (14,3,5): | 56.09 | |
| TEMA (21): | 46.75 | |
| Williams %R (14): | -52.16 | |
| Chande Momentum Oscillator (20): | -0.49 | |
| Repulse (5,40,3): | -1.8300 | |
| ROCnROLL: | 2 | |
| TRIX (15,9): | 0.0700 | |
| Courbe Coppock: | 1.12 |
| MA7: | 46.46 | |
| MA20: | 46.28 | |
| MA50: | 45.21 | |
| MA100: | 48.32 | |
| MAexp7: | 46.39 | |
| MAexp20: | 46.21 | |
| MAexp50: | 46.50 | |
| MAexp100: | 47.80 | |
| Price / MA7: | -0.56% | |
| Price / MA20: | -0.17% | |
| Price / MA50: | +2.19% | |
| Price / MA100: | -4.39% | |
| Price / MAexp7: | -0.41% | |
| Price / MAexp20: | -0.02% | |
| Price / MAexp50: | -0.65% | |
| Price / MAexp100: | -3.35% |
News
The last news published on ORTHOFIX MEDICAL INC. at the time of the generation of this analysis was as follows:
- Orthofix Names Kevin Kenny President of Global Spine Business
- Orthofix Schedules Third Quarter 2019 Earnings Release and Conference Call for October 28, 2019
- Orthofix Announces FDA Approval of the M6-C Artificial Cervical Disc to Treat Patients with Cervical Disc Degeneration
- Orthofix Schedules Fourth Quarter and Fiscal 2018 Earnings Release and Conference Call for February 25, 2019
- Orthofix International NV to Host Earnings Call
About author

Online


Add a comment
Comments
0 comments on the analysis ORTHOFIX MEDICAL INC. - Daily