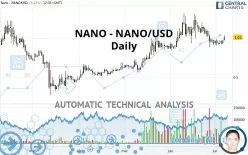
NANO - XNO/USD - Daily - Technical analysis published on 07/07/2020 (GMT)
- 261
- 0
- Who voted?
Click here for a new analysis!
- Timeframe : Daily
- - Analysis generated on
- Status : TARGET REACHED

Summary of the analysis

Additional analysis
Quotes
The NANO - NANO/USD rating is 1.010000 USD. On the day, this instrument gained +4.12% and was traded between 0.970000 USD and 1.040000 USD over the period. The price is currently at +4.12% from its lowest and -2.88% from its highest.Here is a more detailed summary of the historical variations registered by NANO - NANO/USD:
Abnormal volumes
Timeframe : 5 days
Abnormal volumes
Timeframe : 20 days
Abnormal volumes
Timeframe : 50 days
Technical
Technical analysis of this Daily chart of NANO - NANO/USD indicates that the overall trend is strongly bullish. 82.14% of the signals given by moving averages are bullish. The slightly bullish signals given by the short-term moving averages indicate this trend is showing signs of running out of steam. There is no crossing of moving average by the price or crossing of moving averages between themselves.
The probability of a further increase is slight given the direction of the technical indicators.
But beware of excesses. The Central Indicators scanner currently detects this:
Williams %R indicator is overbought : over -20
Type : Neutral
Timeframe : Daily
Pivot points : price is over resistance 2
Type : Neutral
Timeframe : Daily
Price is back over the pivot point
Type : Bullish
Timeframe : Weekly
An analysis of the price chart with the Central Patterns scanner (detector of chart patterns and resistances and supports) shows several results that can have an impact on the price change:
Horizontal resistance is broken
Type : Bullish
Timeframe : Daily
Support of channel is broken
Type : Bearish
Timeframe : Daily
No result was found by the Central Candlesticks scanner on Japanese candlesticks.
| S3 | S2 | S1 | Price | R1 | R2 | R3 | |
|---|---|---|---|---|---|---|---|
| ProTrendLines | 0.740000 | 0.870000 | 0.960000 | 1.010000 | 1.050000 | 1.150000 | 1.230000 |
| Change (%) | -26.73% | -13.86% | -4.95% | - | +3.96% | +13.86% | +21.78% |
| Change | -0.270000 | -0.140000 | -0.050000 | - | +0.040000 | +0.140000 | +0.220000 |
| Level | Minor | Major | Intermediate | - | Minor | Major | Major |
Pivot points can also be used to set your price objectives. Here is the price situation in relation to pivot points:
| Pivot points | S3 | S2 | S1 | PP | R1 | R2 | R3 |
|---|---|---|---|---|---|---|---|
| Standard | 0.890000 | 0.910000 | 0.940000 | 0.960000 | 0.990000 | 1.010000 | 1.040000 |
| Camarilla | 0.956250 | 0.960833 | 0.965417 | 0.970000 | 0.974583 | 0.979167 | 0.983750 |
| Woodie | 0.895000 | 0.912500 | 0.945000 | 0.962500 | 0.995000 | 1.012500 | 1.045000 |
| Fibonacci | 0.910000 | 0.929100 | 0.940900 | 0.960000 | 0.979100 | 0.990900 | 1.010000 |
| Pivot points | S3 | S2 | S1 | PP | R1 | R2 | R3 |
|---|---|---|---|---|---|---|---|
| Standard | 0.806667 | 0.853333 | 0.906667 | 0.953333 | 1.006667 | 1.053333 | 1.106667 |
| Camarilla | 0.932500 | 0.941667 | 0.950833 | 0.960000 | 0.969167 | 0.978333 | 0.987500 |
| Woodie | 0.810000 | 0.855000 | 0.910000 | 0.955000 | 1.010000 | 1.055000 | 1.110000 |
| Fibonacci | 0.853333 | 0.891533 | 0.915133 | 0.953333 | 0.991533 | 1.015133 | 1.053333 |
| Pivot points | S3 | S2 | S1 | PP | R1 | R2 | R3 |
|---|---|---|---|---|---|---|---|
| Standard | 0.260000 | 0.550000 | 0.740000 | 1.030000 | 1.220000 | 1.510000 | 1.700000 |
| Camarilla | 0.798000 | 0.842000 | 0.886000 | 0.930000 | 0.974000 | 1.018000 | 1.062000 |
| Woodie | 0.210000 | 0.525000 | 0.690000 | 1.005000 | 1.170000 | 1.485000 | 1.650000 |
| Fibonacci | 0.550000 | 0.733360 | 0.846640 | 1.030000 | 1.213360 | 1.326640 | 1.510000 |
Numerical data
The following are the details of the technical indicators and moving averages that were collected to generate this technical analysis:
| RSI (14): | 51.13 | |
| MACD (12,26,9): | -0.0180 | |
| Directional Movement: | 1.021279 | |
| AROON (14): | -28.571428 | |
| DEMA (21): | 0.982307 | |
| Parabolic SAR (0,02-0,02-0,2): | 1.231341 | |
| Elder Ray (13): | 0.021185 | |
| Super Trend (3,10): | 1.195184 | |
| Zig ZAG (10): | 1.010000 | |
| VORTEX (21): | 0.9543 | |
| Stochastique (14,3,5): | 32.83 | |
| TEMA (21): | 0.934806 | |
| Williams %R (14): | -50.00 | |
| Chande Momentum Oscillator (20): | -0.080000 | |
| Repulse (5,40,3): | 4.9797 | |
| ROCnROLL: | 1 | |
| TRIX (15,9): | -0.1277 | |
| Courbe Coppock: | 26.88 |
| MA7: | 0.954286 | |
| MA20: | 1.023500 | |
| MA50: | 1.001200 | |
| MA100: | 0.802700 | |
| MAexp7: | 0.968392 | |
| MAexp20: | 0.996509 | |
| MAexp50: | 0.960910 | |
| MAexp100: | 0.876826 | |
| Price / MA7: | +5.84% | |
| Price / MA20: | -1.32% | |
| Price / MA50: | +0.88% | |
| Price / MA100: | +25.83% | |
| Price / MAexp7: | +4.30% | |
| Price / MAexp20: | +1.35% | |
| Price / MAexp50: | +5.11% | |
| Price / MAexp100: | +15.19% |
About author

Online


Add a comment
Comments
0 comments on the analysis NANO - XNO/USD - Daily