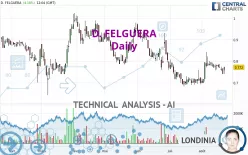
D. FELGUERA - Daily - Technical analysis published on 08/22/2022 (GMT)
- 167
- 0
Click here for a new analysis!
- Timeframe : Daily
- - Analysis generated on
- Status : INVALID

Summary of the analysis

Additional analysis
Quotes
The D. FELGUERA rating is 0.772 EUR. The price has increased by +4.18% since the last closing and was between 0.742 EUR and 0.775 EUR. This implies that the price is at +4.04% from its lowest and at -0.39% from its highest.The Central Gaps scanner detects a bullish opening. A small advantage for buyers in the very short term.
Bullish opening
Type : Bullish
Timeframe : Openning
Here is a more detailed summary of the historical variations registered by D. FELGUERA:
Technical
Technical analysis of D. FELGUERA in Daily shows an overall bearish trend. 64.29% of the signals given by moving averages are bearish. Caution: the slightly bullish signals currently given by short-term moving averages show a possible weakening of the global trend. An assessment of moving averages reveals several bullish signals that could impact this trend:
Bullish price crossover with Moving Average 20
Type : Bullish
Timeframe : Daily
Bullish price crossover with Moving Average 50
Type : Bullish
Timeframe : Daily
Bullish price crossover with adaptative moving average 20
Type : Bullish
Timeframe : Daily
In fact, of the 18 technical indicators analysed by Central Analyzer, 5 are bullish, 9 are neutral and 4 are bearish. Other results related to technical indicators were also found by the Central Indicators scanner:
Pivot points : price is over resistance 1
Type : Neutral
Timeframe : Daily
RSI indicator is back over 50
Type : Bullish
Timeframe : Daily
An analysis of the price chart with the Central Patterns scanner (detector of chart patterns and resistances and supports) shows several results that can have an impact on the price change:
Near horizontal resistance
Type : Bearish
Timeframe : Daily
Near support of channel
Type : Bullish
Timeframe : Daily
The Central Candlesticks scanner, specialised in Japanese candlesticks, did not identify any signals.
| S3 | S2 | S1 | Price | R1 | R2 | R3 | |
|---|---|---|---|---|---|---|---|
| ProTrendLines | 0.462 | 0.643 | 0.714 | 0.772 | 0.786 | 0.884 | 0.950 |
| Change (%) | -40.16% | -16.71% | -7.51% | - | +1.81% | +14.51% | +23.06% |
| Change | -0.310 | -0.129 | -0.058 | - | +0.014 | +0.112 | +0.178 |
| Level | Minor | Major | Intermediate | - | Intermediate | Minor | Major |
To determine price objectives, it is also possible to use the pivot points. Here is the price position in relation to pivot points:
| Pivot points | S3 | S2 | S1 | PP | R1 | R2 | R3 |
|---|---|---|---|---|---|---|---|
| Standard | 0.706 | 0.723 | 0.732 | 0.749 | 0.758 | 0.775 | 0.784 |
| Camarilla | 0.734 | 0.736 | 0.739 | 0.741 | 0.743 | 0.746 | 0.748 |
| Woodie | 0.702 | 0.721 | 0.728 | 0.747 | 0.754 | 0.773 | 0.780 |
| Fibonacci | 0.723 | 0.733 | 0.739 | 0.749 | 0.759 | 0.765 | 0.775 |
| Pivot points | S3 | S2 | S1 | PP | R1 | R2 | R3 |
|---|---|---|---|---|---|---|---|
| Standard | 0.677 | 0.708 | 0.725 | 0.756 | 0.773 | 0.804 | 0.821 |
| Camarilla | 0.728 | 0.732 | 0.737 | 0.741 | 0.745 | 0.750 | 0.754 |
| Woodie | 0.669 | 0.705 | 0.717 | 0.753 | 0.765 | 0.801 | 0.813 |
| Fibonacci | 0.708 | 0.727 | 0.738 | 0.756 | 0.775 | 0.786 | 0.804 |
| Pivot points | S3 | S2 | S1 | PP | R1 | R2 | R3 |
|---|---|---|---|---|---|---|---|
| Standard | 0.526 | 0.604 | 0.652 | 0.730 | 0.778 | 0.856 | 0.904 |
| Camarilla | 0.665 | 0.677 | 0.689 | 0.700 | 0.712 | 0.723 | 0.735 |
| Woodie | 0.511 | 0.597 | 0.637 | 0.723 | 0.763 | 0.849 | 0.889 |
| Fibonacci | 0.604 | 0.652 | 0.682 | 0.730 | 0.778 | 0.808 | 0.856 |
Numerical data
The following is the status of technical indicators and moving averages registered at the time this technical analysis was created:
| RSI (14): | 53.69 | |
| MACD (12,26,9): | 0.0040 | |
| Directional Movement: | 3.085 | |
| AROON (14): | 14.286 | |
| DEMA (21): | 0.763 | |
| Parabolic SAR (0,02-0,02-0,2): | 0.838 | |
| Elder Ray (13): | -0.005 | |
| Super Trend (3,10): | 0.695 | |
| Zig ZAG (10): | 0.772 | |
| VORTEX (21): | 1.0650 | |
| Stochastique (14,3,5): | 39.84 | |
| TEMA (21): | 0.778 | |
| Williams %R (14): | -51.80 | |
| Chande Momentum Oscillator (20): | -0.005 | |
| Repulse (5,40,3): | -0.8720 | |
| ROCnROLL: | -1 | |
| TRIX (15,9): | 0.0780 | |
| Courbe Coppock: | 11.86 |
| MA7: | 0.767 | |
| MA20: | 0.755 | |
| MA50: | 0.762 | |
| MA100: | 0.827 | |
| MAexp7: | 0.765 | |
| MAexp20: | 0.760 | |
| MAexp50: | 0.772 | |
| MAexp100: | 0.802 | |
| Price / MA7: | +0.65% | |
| Price / MA20: | +2.25% | |
| Price / MA50: | +1.31% | |
| Price / MA100: | -6.65% | |
| Price / MAexp7: | +0.92% | |
| Price / MAexp20: | +1.58% | |
| Price / MAexp50: | -0% | |
| Price / MAexp100: | -3.74% |
About author
Online


Add a comment
Comments
0 comments on the analysis D. FELGUERA - Daily